| __timestamp | RB Global, Inc. | Trane Technologies plc |
|---|---|---|
| Wednesday, January 1, 2014 | 423213000 | 3908600000 |
| Thursday, January 1, 2015 | 459849000 | 3999100000 |
| Friday, January 1, 2016 | 500333000 | 4179600000 |
| Sunday, January 1, 2017 | 531504000 | 4386000000 |
| Monday, January 1, 2018 | 636629000 | 4820600000 |
| Tuesday, January 1, 2019 | 672825000 | 5147400000 |
| Wednesday, January 1, 2020 | 761671000 | 3803400000 |
| Friday, January 1, 2021 | 822188000 | 4469600000 |
| Saturday, January 1, 2022 | 957107000 | 4964800000 |
| Sunday, January 1, 2023 | 1778400000 | 5857200000 |
| Monday, January 1, 2024 | 4284200000 | 7080500000 |
Data in motion
In the competitive landscape of industrial giants, Trane Technologies plc and RB Global, Inc. have been vying for supremacy in gross profit generation over the past decade. From 2014 to 2023, Trane Technologies consistently outperformed RB Global, boasting a gross profit that was approximately 5 to 10 times higher each year. Notably, in 2023, Trane Technologies achieved a remarkable gross profit of nearly $5.9 billion, a 50% increase from its 2014 figure. Meanwhile, RB Global saw a significant surge in 2023, with its gross profit reaching $1.8 billion, more than quadrupling its 2014 performance. This growth trajectory highlights the dynamic shifts in the industrial sector, where strategic innovations and market adaptations play pivotal roles. As these companies continue to evolve, their financial narratives offer valuable insights into the broader economic trends shaping the industry.
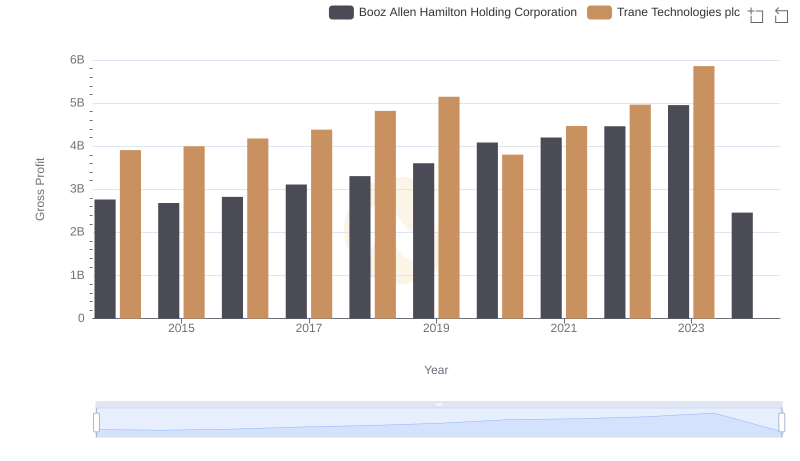
Key Insights on Gross Profit: Trane Technologies plc vs Booz Allen Hamilton Holding Corporation
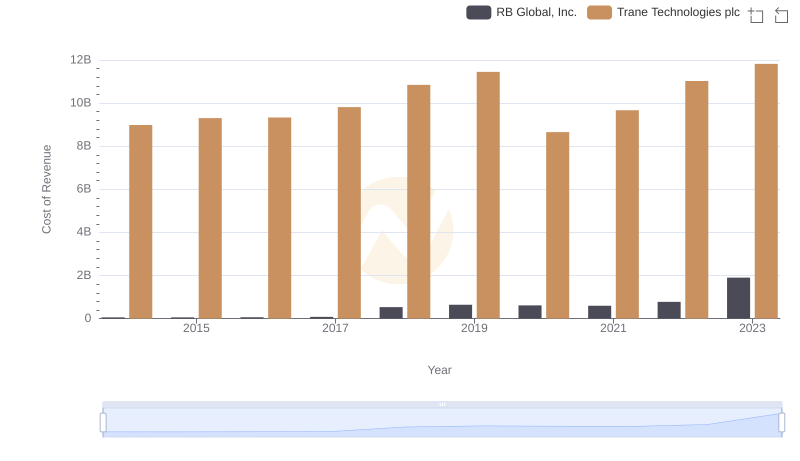
Cost Insights: Breaking Down Trane Technologies plc and RB Global, Inc.'s Expenses
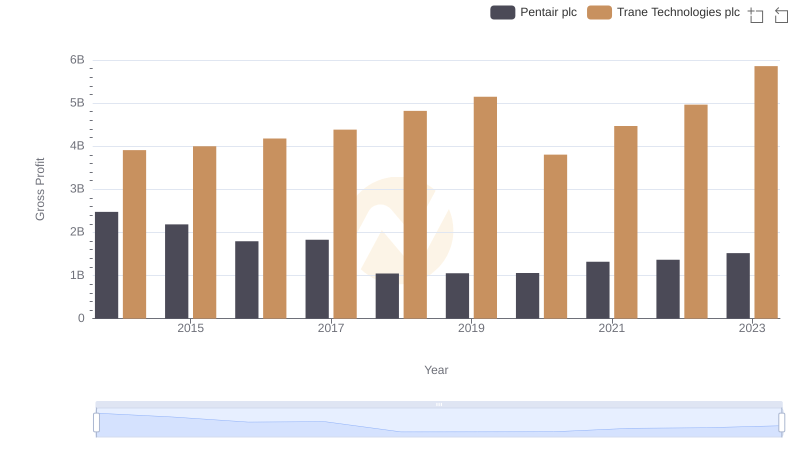
Trane Technologies plc and Pentair plc: A Detailed Gross Profit Analysis
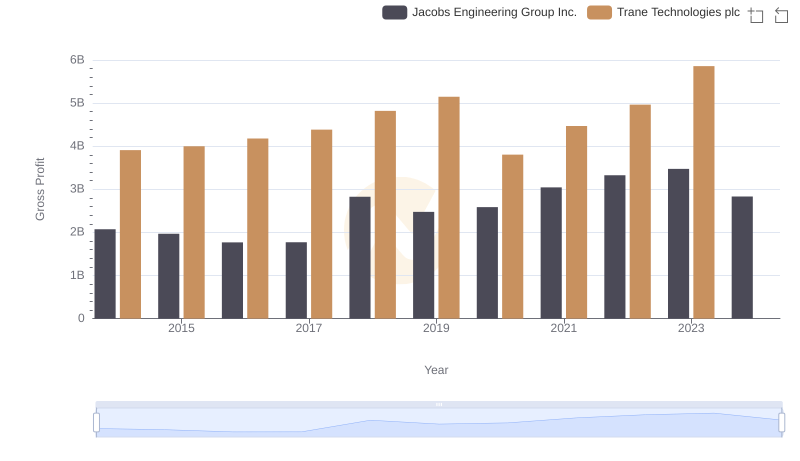
Who Generates Higher Gross Profit? Trane Technologies plc or Jacobs Engineering Group Inc.
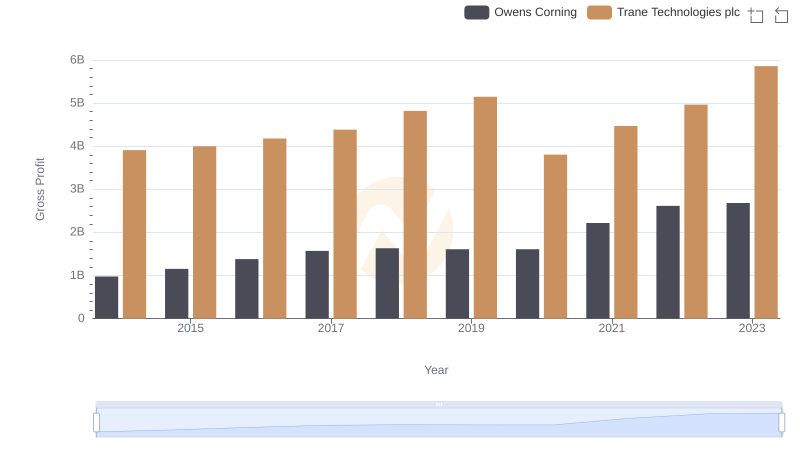
Gross Profit Analysis: Comparing Trane Technologies plc and Owens Corning
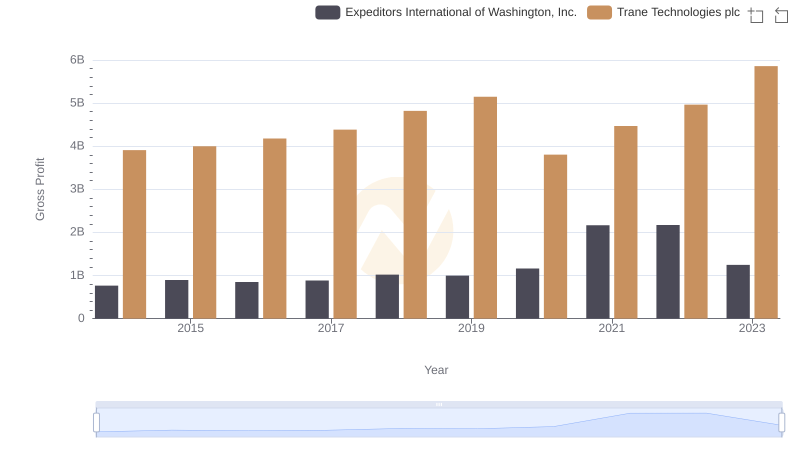
Trane Technologies plc vs Expeditors International of Washington, Inc.: A Gross Profit Performance Breakdown
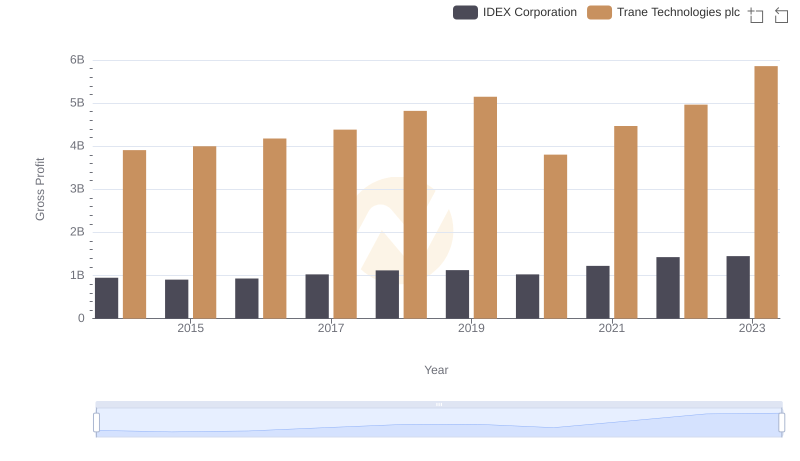
Trane Technologies plc vs IDEX Corporation: A Gross Profit Performance Breakdown
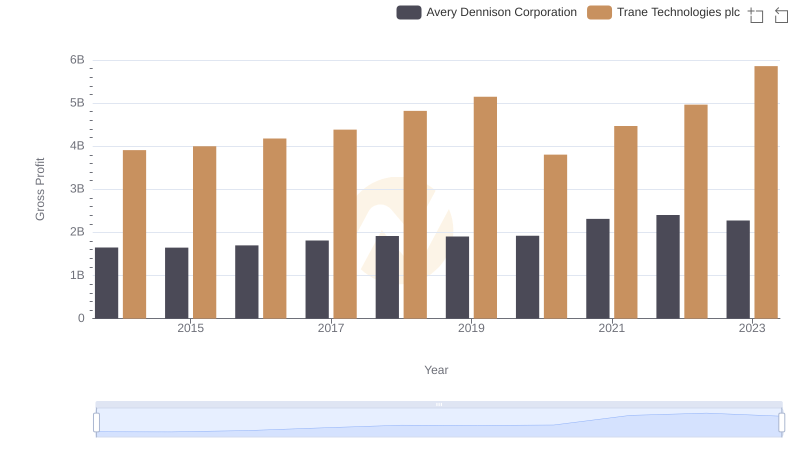
Trane Technologies plc vs Avery Dennison Corporation: A Gross Profit Performance Breakdown
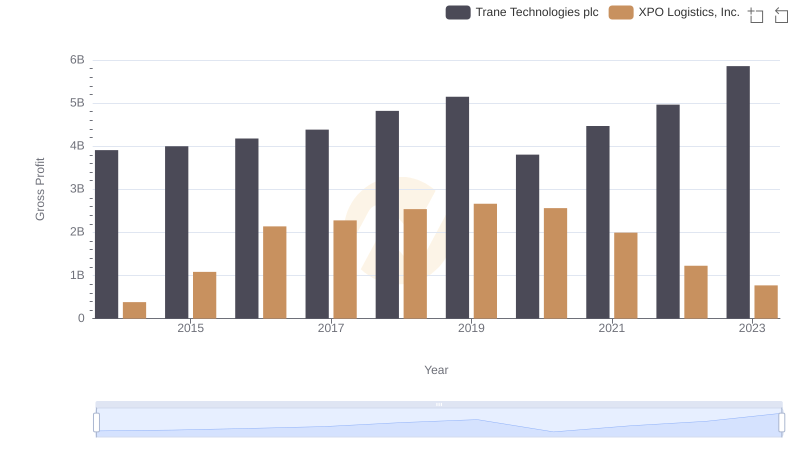
Key Insights on Gross Profit: Trane Technologies plc vs XPO Logistics, Inc.
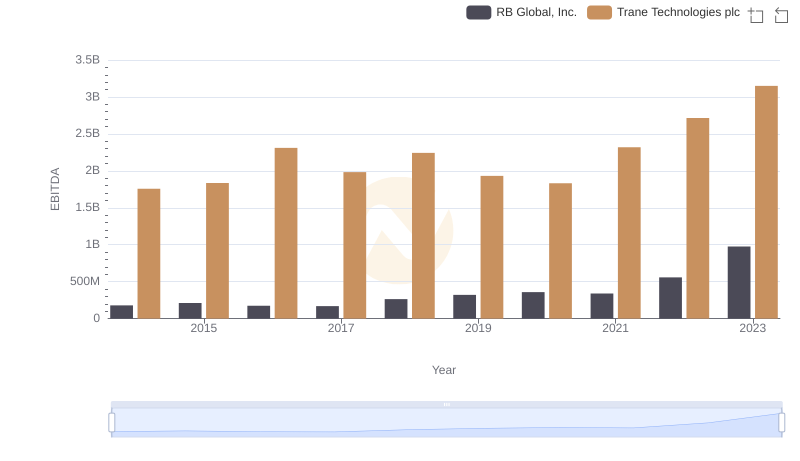
Comprehensive EBITDA Comparison: Trane Technologies plc vs RB Global, Inc.