| __timestamp | EMCOR Group, Inc. | Stanley Black & Decker, Inc. |
|---|---|---|
| Wednesday, January 1, 2014 | 5517719000 | 7235900000 |
| Thursday, January 1, 2015 | 5774247000 | 7099800000 |
| Friday, January 1, 2016 | 6513662000 | 7139700000 |
| Sunday, January 1, 2017 | 6539987000 | 7969200000 |
| Monday, January 1, 2018 | 6925178000 | 9080500000 |
| Tuesday, January 1, 2019 | 7818743000 | 9636700000 |
| Wednesday, January 1, 2020 | 7401679000 | 9566700000 |
| Friday, January 1, 2021 | 8401843000 | 10423000000 |
| Saturday, January 1, 2022 | 9472526000 | 12663300000 |
| Sunday, January 1, 2023 | 10493534000 | 11683100000 |
| Monday, January 1, 2024 | 10851300000 |
In pursuit of knowledge
In the ever-evolving landscape of industrial services and tools, understanding cost structures is pivotal. Over the past decade, EMCOR Group, Inc. and Stanley Black & Decker, Inc. have showcased intriguing trends in their cost of revenue. From 2014 to 2023, EMCOR's cost of revenue surged by approximately 90%, reflecting its strategic expansions and operational efficiencies. Meanwhile, Stanley Black & Decker experienced a 61% increase, highlighting its robust market presence and innovation-driven growth.
By 2023, EMCOR's cost of revenue reached a peak, marking a 14% rise from the previous year, while Stanley Black & Decker saw a slight decline of 8% from its 2022 high. These shifts underscore the dynamic nature of cost management in response to market demands and economic conditions. As these industry giants continue to adapt, their cost strategies will remain a focal point for investors and analysts alike.

Annual Revenue Comparison: EMCOR Group, Inc. vs Stanley Black & Decker, Inc.
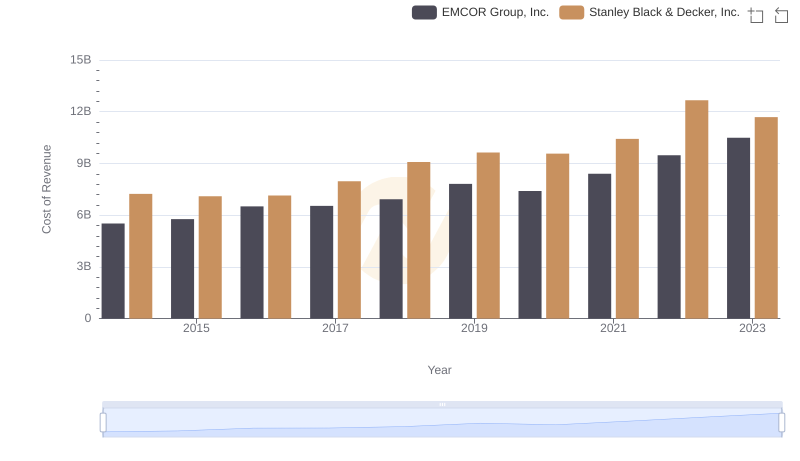
Cost of Revenue Trends: EMCOR Group, Inc. vs Stanley Black & Decker, Inc.
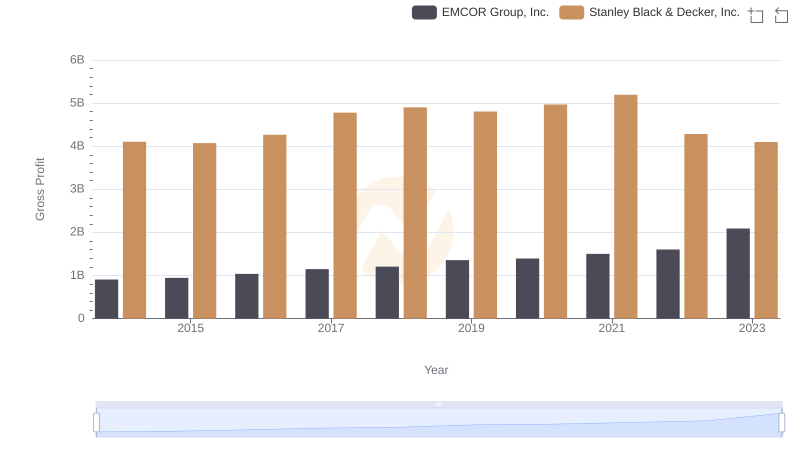
Key Insights on Gross Profit: EMCOR Group, Inc. vs Stanley Black & Decker, Inc.

A Professional Review of EBITDA: EMCOR Group, Inc. Compared to Stanley Black & Decker, Inc.
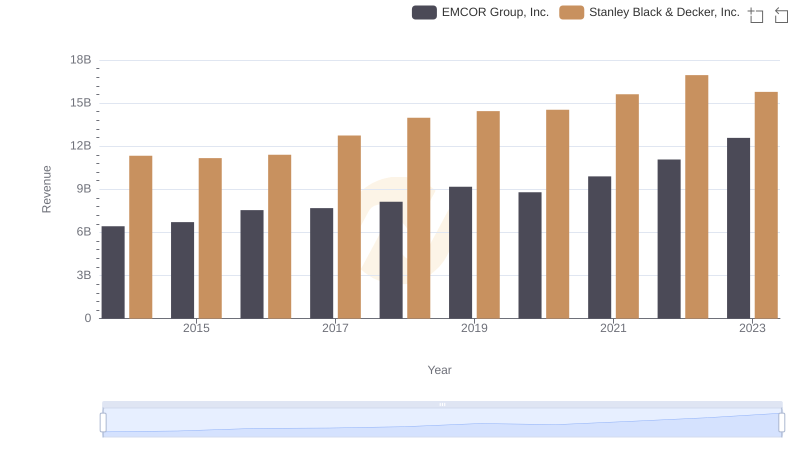
EMCOR Group, Inc. or Stanley Black & Decker, Inc.: Who Leads in Yearly Revenue?
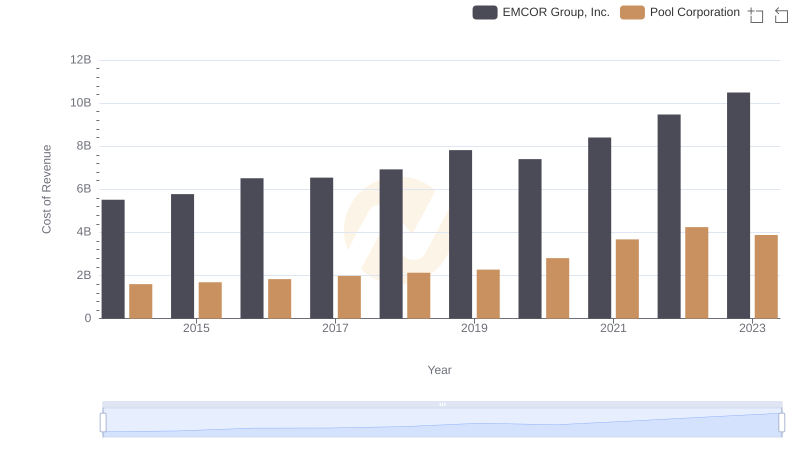
Cost of Revenue Comparison: EMCOR Group, Inc. vs Pool Corporation
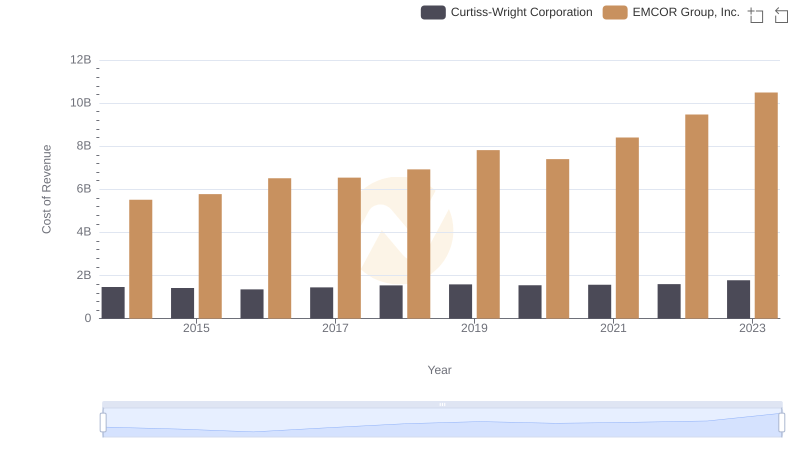
Comparing Cost of Revenue Efficiency: EMCOR Group, Inc. vs Curtiss-Wright Corporation
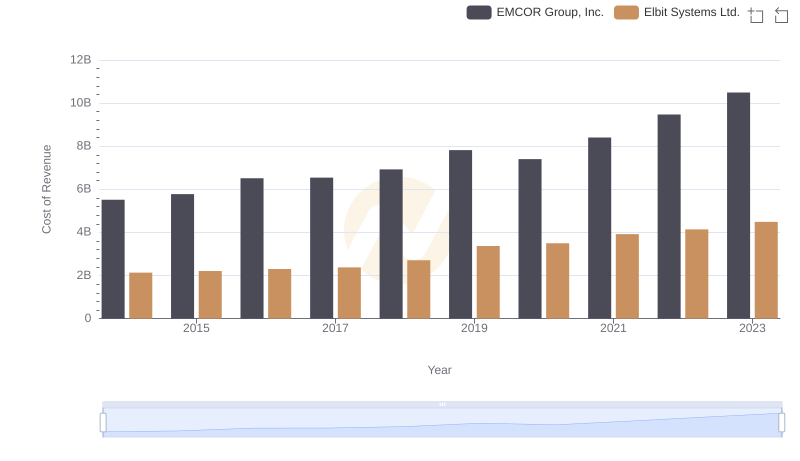
Cost of Revenue Trends: EMCOR Group, Inc. vs Elbit Systems Ltd.

Gross Profit Comparison: EMCOR Group, Inc. and Stanley Black & Decker, Inc. Trends
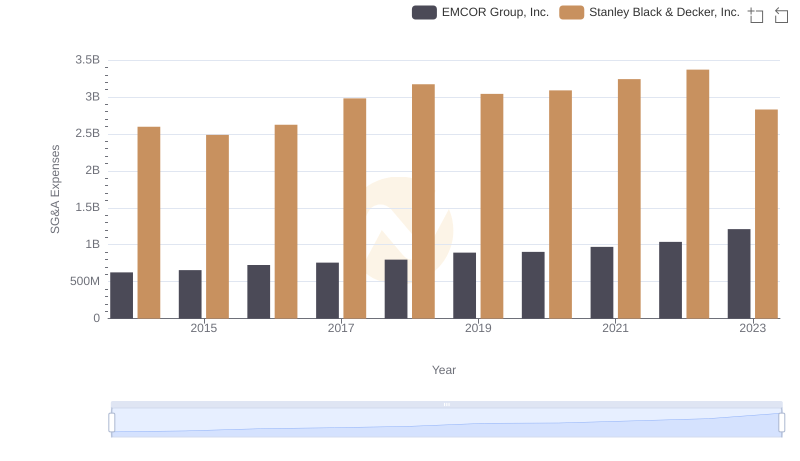
Selling, General, and Administrative Costs: EMCOR Group, Inc. vs Stanley Black & Decker, Inc.
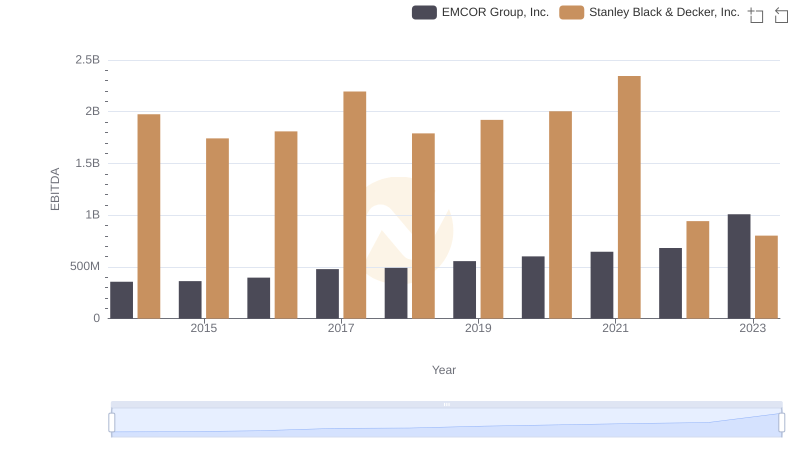
EMCOR Group, Inc. and Stanley Black & Decker, Inc.: A Detailed Examination of EBITDA Performance