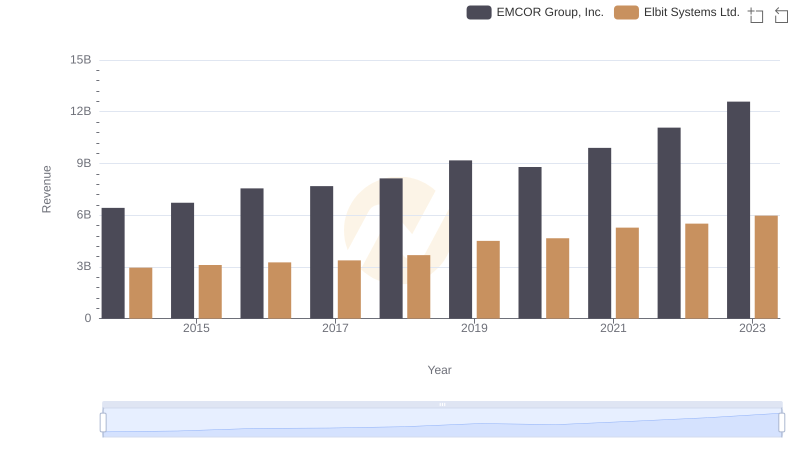
| __timestamp | EMCOR Group, Inc. | Elbit Systems Ltd. |
|---|---|---|
| Wednesday, January 1, 2014 | 5517719000 | 2133151000 |
| Thursday, January 1, 2015 | 5774247000 | 2210528000 |
| Friday, January 1, 2016 | 6513662000 | 2300636000 |
| Sunday, January 1, 2017 | 6539987000 | 2379905000 |
| Monday, January 1, 2018 | 6925178000 | 2707505000 |
| Tuesday, January 1, 2019 | 7818743000 | 3371933000 |
| Wednesday, January 1, 2020 | 7401679000 | 3497465000 |
| Friday, January 1, 2021 | 8401843000 | 3920473000 |
| Saturday, January 1, 2022 | 9472526000 | 4138266000 |
| Sunday, January 1, 2023 | 10493534000 | 4491790000 |
Unlocking the unknown
In the ever-evolving landscape of global business, understanding cost structures is pivotal. Over the past decade, EMCOR Group, Inc. and Elbit Systems Ltd. have showcased intriguing trends in their cost of revenue. From 2014 to 2023, EMCOR Group, Inc. has seen a robust increase of approximately 90% in its cost of revenue, reflecting its expanding operations and market reach. In contrast, Elbit Systems Ltd. experienced a more modest growth of around 110%, indicating a steady yet significant expansion in its operational costs.
This comparative analysis highlights the dynamic nature of these companies' financial strategies. While EMCOR's cost of revenue surged, Elbit Systems maintained a consistent upward trajectory, underscoring its strategic investments in technology and defense sectors. As we delve deeper into these trends, it becomes evident that both companies are navigating their growth paths with distinct approaches, offering valuable insights into their operational efficiencies and market strategies.
Comparing Revenue Performance: EMCOR Group, Inc. or Elbit Systems Ltd.?
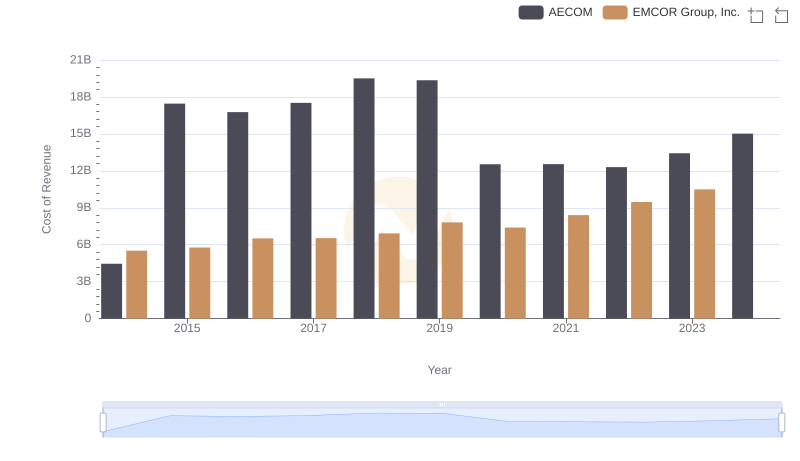
Cost of Revenue Trends: EMCOR Group, Inc. vs AECOM

Comparing Cost of Revenue Efficiency: EMCOR Group, Inc. vs Saia, Inc.
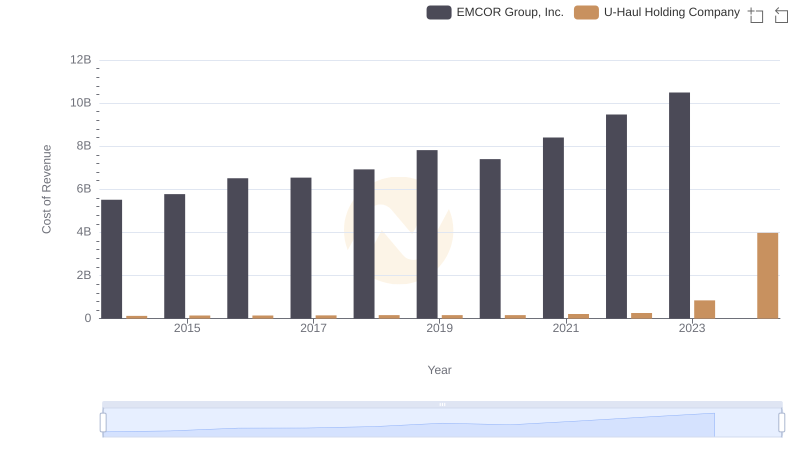
EMCOR Group, Inc. vs U-Haul Holding Company: Efficiency in Cost of Revenue Explored
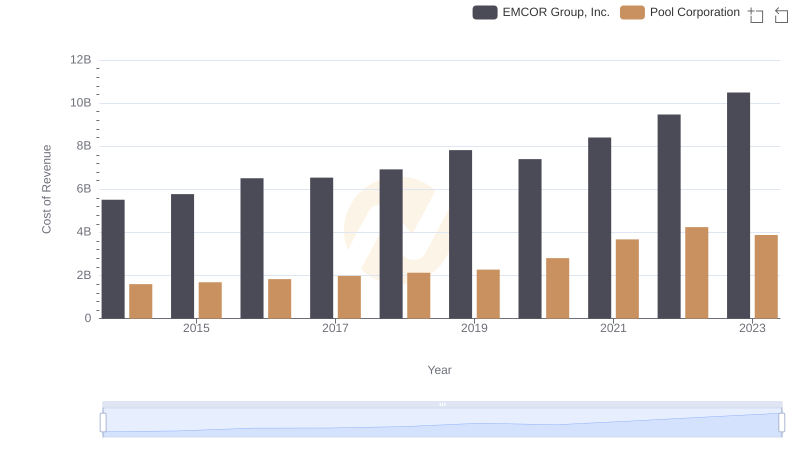
Cost of Revenue Comparison: EMCOR Group, Inc. vs Pool Corporation
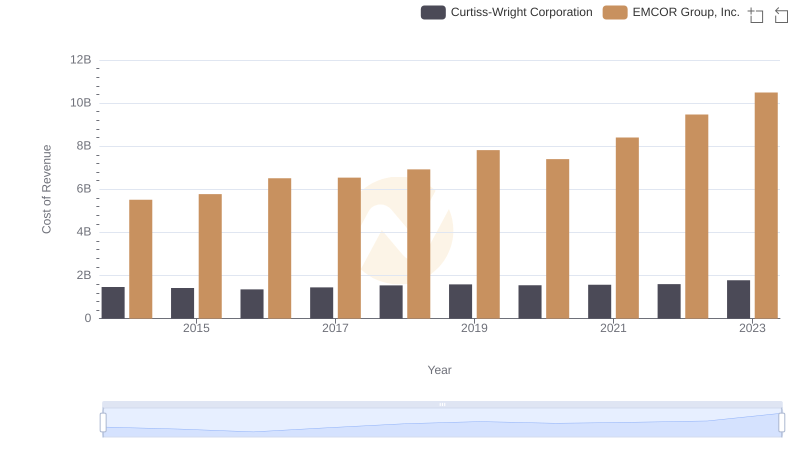
Comparing Cost of Revenue Efficiency: EMCOR Group, Inc. vs Curtiss-Wright Corporation
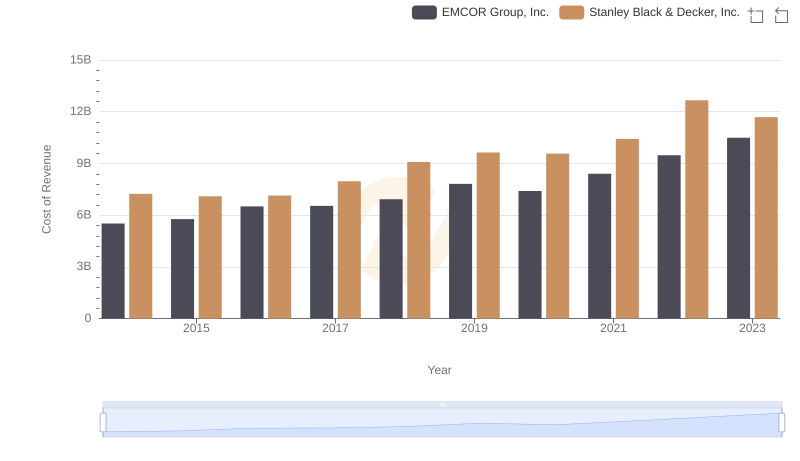
Cost of Revenue: Key Insights for EMCOR Group, Inc. and Stanley Black & Decker, Inc.
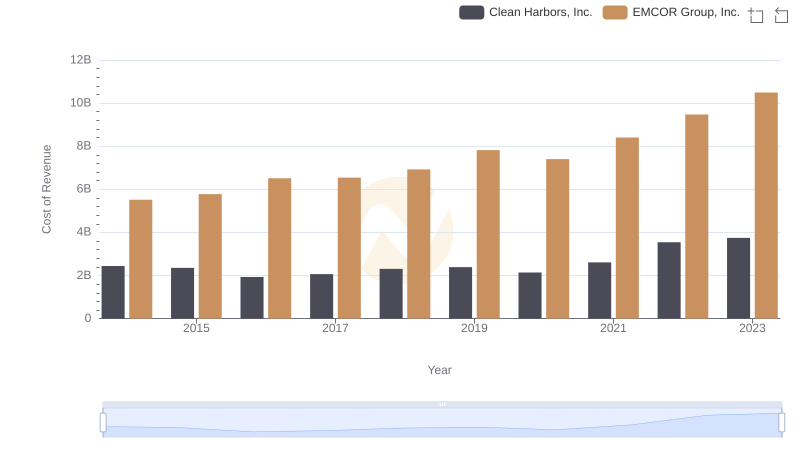
Cost of Revenue Trends: EMCOR Group, Inc. vs Clean Harbors, Inc.
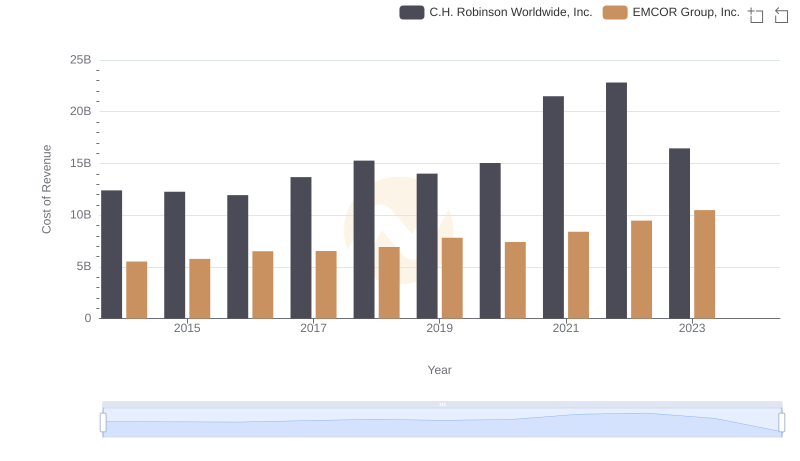
Cost of Revenue Comparison: EMCOR Group, Inc. vs C.H. Robinson Worldwide, Inc.
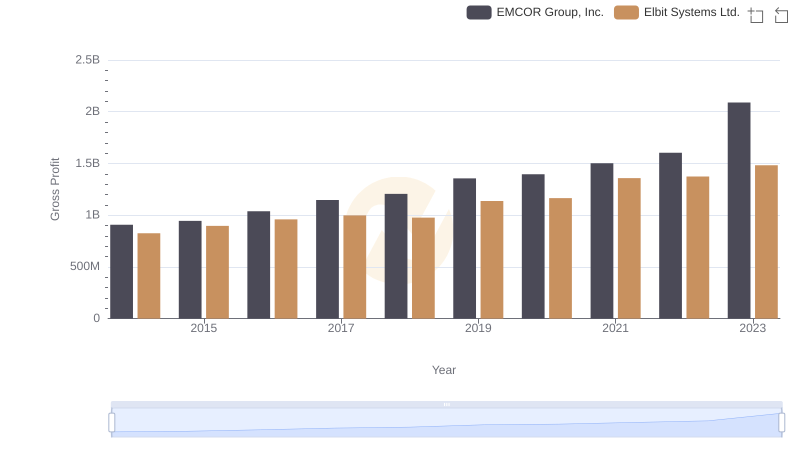
EMCOR Group, Inc. vs Elbit Systems Ltd.: A Gross Profit Performance Breakdown
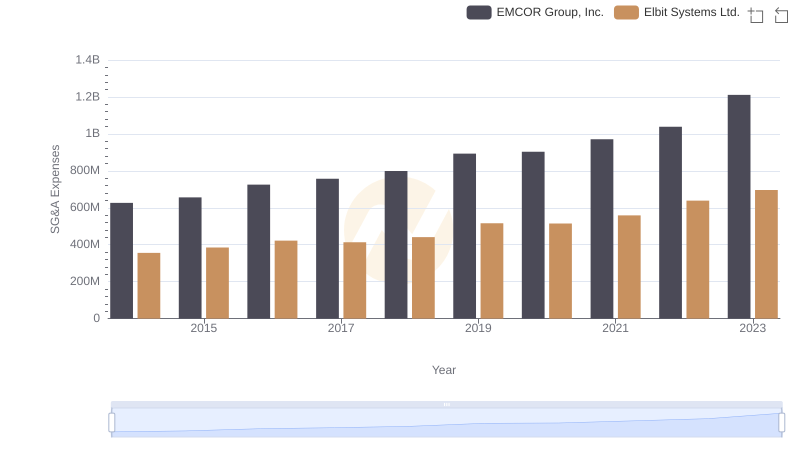
Breaking Down SG&A Expenses: EMCOR Group, Inc. vs Elbit Systems Ltd.
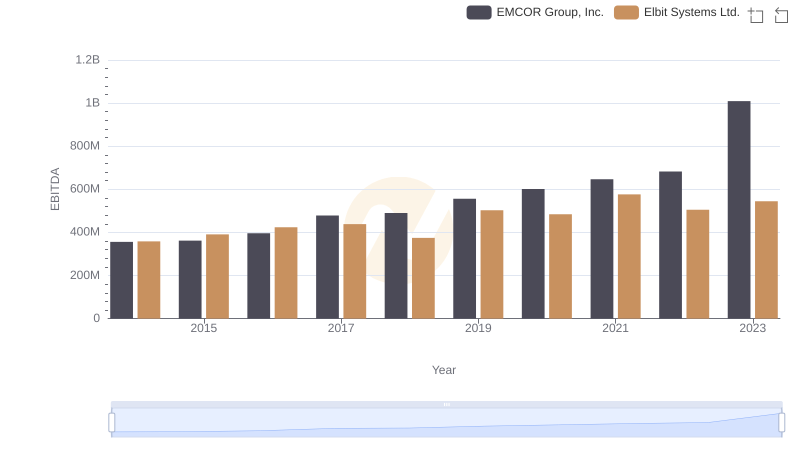
Professional EBITDA Benchmarking: EMCOR Group, Inc. vs Elbit Systems Ltd.