| __timestamp | C.H. Robinson Worldwide, Inc. | EMCOR Group, Inc. |
|---|---|---|
| Wednesday, January 1, 2014 | 12401436000 | 5517719000 |
| Thursday, January 1, 2015 | 12259014000 | 5774247000 |
| Friday, January 1, 2016 | 11931821000 | 6513662000 |
| Sunday, January 1, 2017 | 13680857000 | 6539987000 |
| Monday, January 1, 2018 | 15269479000 | 6925178000 |
| Tuesday, January 1, 2019 | 14021726000 | 7818743000 |
| Wednesday, January 1, 2020 | 15037716000 | 7401679000 |
| Friday, January 1, 2021 | 21493659000 | 8401843000 |
| Saturday, January 1, 2022 | 22826428000 | 9472526000 |
| Sunday, January 1, 2023 | 16457570000 | 10493534000 |
| Monday, January 1, 2024 | 16416191000 |
Cracking the code
In the ever-evolving landscape of the U.S. stock market, understanding the cost dynamics of major players is crucial. Over the past decade, EMCOR Group, Inc. and C.H. Robinson Worldwide, Inc. have showcased intriguing trends in their cost of revenue. From 2014 to 2023, C.H. Robinson's cost of revenue fluctuated significantly, peaking in 2022 with a 64% increase from its 2014 figures. Meanwhile, EMCOR Group demonstrated a steady upward trajectory, culminating in a 90% rise by 2023 compared to 2014.
This comparison highlights the contrasting strategies of these industry giants. While C.H. Robinson experienced volatility, EMCOR's consistent growth reflects its robust operational strategies. Notably, the data for 2024 is incomplete, suggesting potential shifts in the coming years. Investors and analysts should keep a keen eye on these trends to make informed decisions in this competitive market.

Comparing Cost of Revenue Efficiency: EMCOR Group, Inc. vs Saia, Inc.
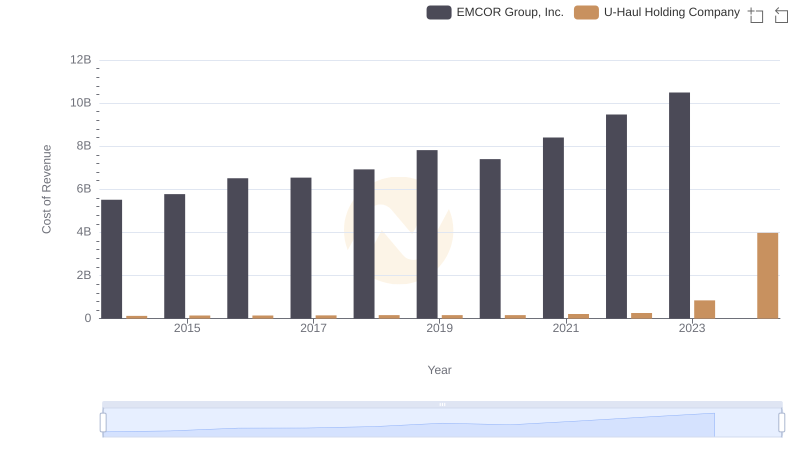
EMCOR Group, Inc. vs U-Haul Holding Company: Efficiency in Cost of Revenue Explored
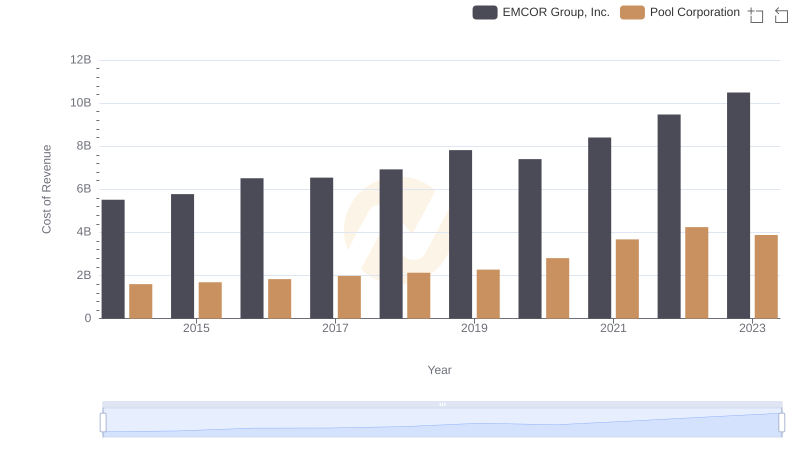
Cost of Revenue Comparison: EMCOR Group, Inc. vs Pool Corporation
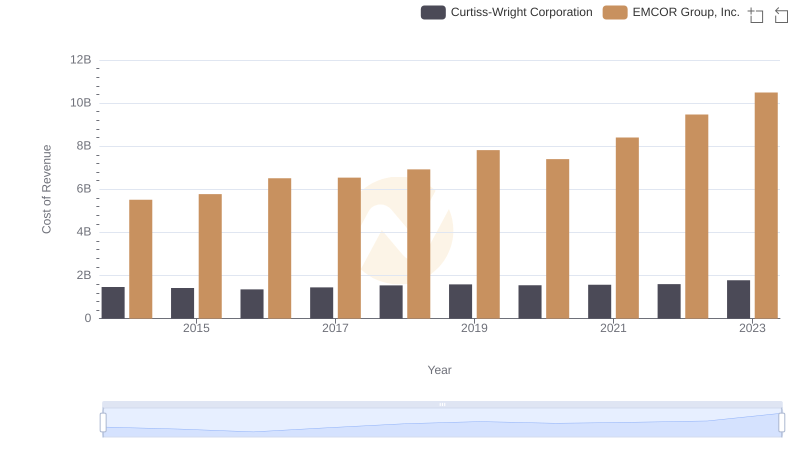
Comparing Cost of Revenue Efficiency: EMCOR Group, Inc. vs Curtiss-Wright Corporation
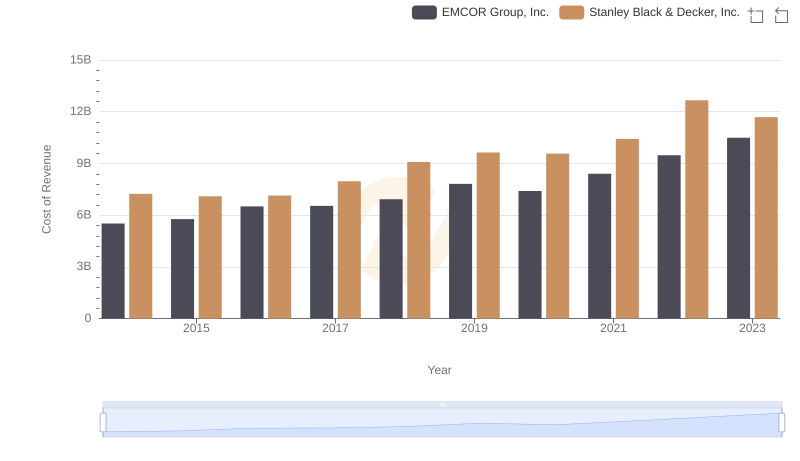
Cost of Revenue: Key Insights for EMCOR Group, Inc. and Stanley Black & Decker, Inc.
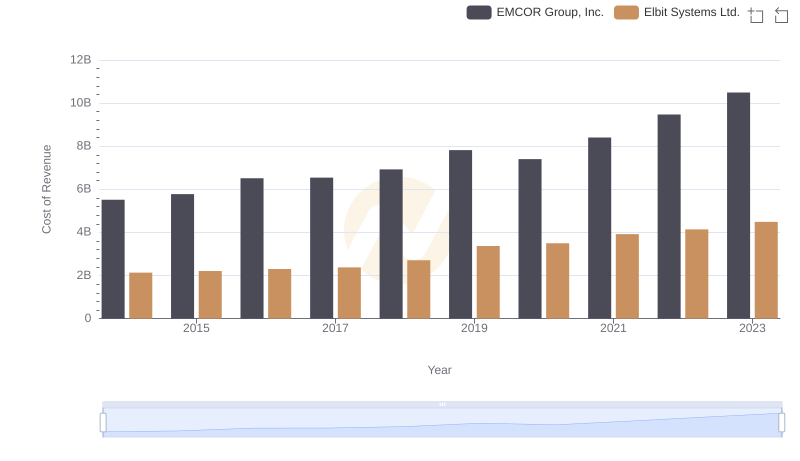
Cost of Revenue Trends: EMCOR Group, Inc. vs Elbit Systems Ltd.
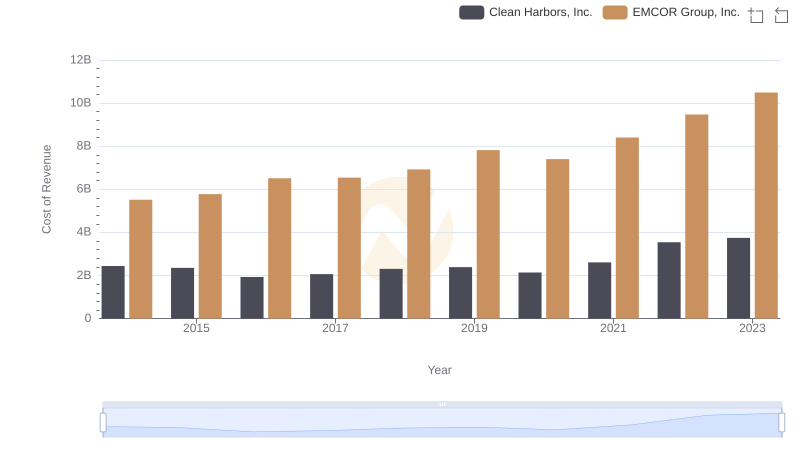
Cost of Revenue Trends: EMCOR Group, Inc. vs Clean Harbors, Inc.
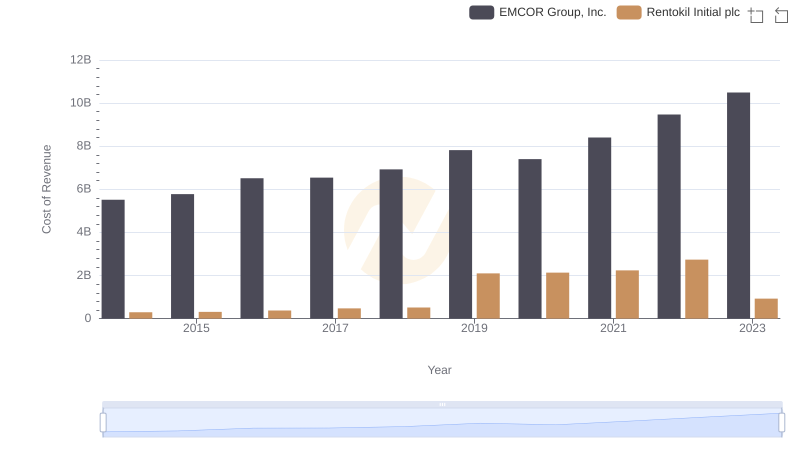
Analyzing Cost of Revenue: EMCOR Group, Inc. and Rentokil Initial plc
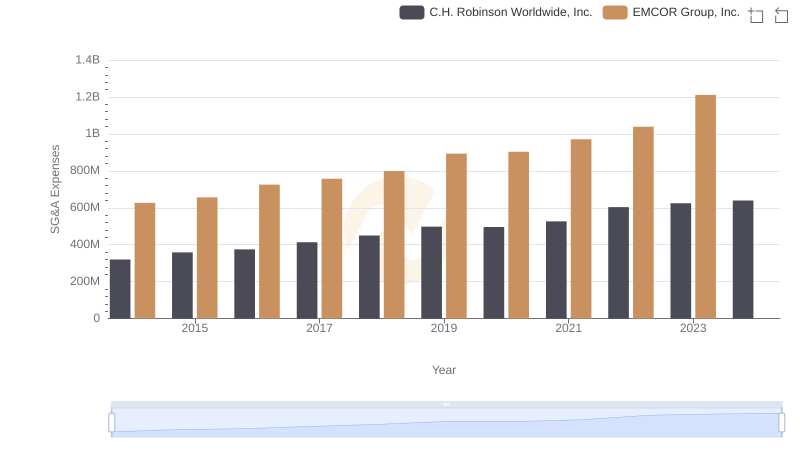
EMCOR Group, Inc. or C.H. Robinson Worldwide, Inc.: Who Manages SG&A Costs Better?
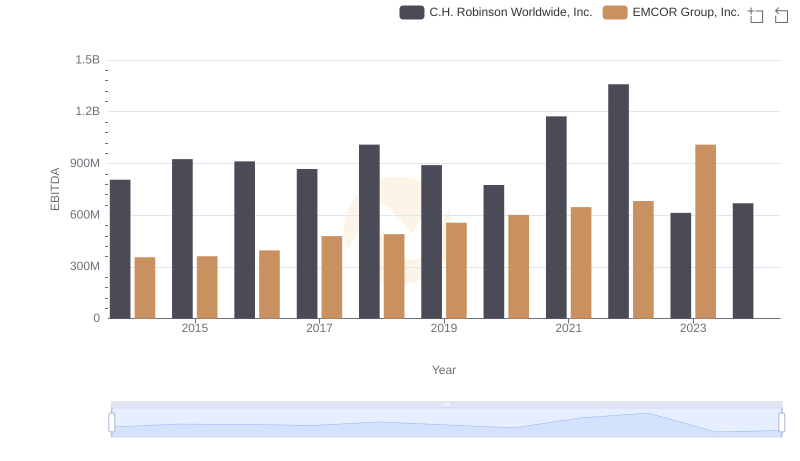
Comparative EBITDA Analysis: EMCOR Group, Inc. vs C.H. Robinson Worldwide, Inc.