| __timestamp | American Airlines Group Inc. | EMCOR Group, Inc. |
|---|---|---|
| Wednesday, January 1, 2014 | 31939000000 | 5517719000 |
| Thursday, January 1, 2015 | 27967000000 | 5774247000 |
| Friday, January 1, 2016 | 28339000000 | 6513662000 |
| Sunday, January 1, 2017 | 31154000000 | 6539987000 |
| Monday, January 1, 2018 | 34490000000 | 6925178000 |
| Tuesday, January 1, 2019 | 35379000000 | 7818743000 |
| Wednesday, January 1, 2020 | 24933000000 | 7401679000 |
| Friday, January 1, 2021 | 29855000000 | 8401843000 |
| Saturday, January 1, 2022 | 39934000000 | 9472526000 |
| Sunday, January 1, 2023 | 40978000000 | 10493534000 |
Infusing magic into the data realm
In the ever-evolving landscape of American business, the cost of revenue serves as a critical indicator of operational efficiency. For EMCOR Group, Inc., a leader in construction and facilities services, and American Airlines Group Inc., a titan in the aviation industry, this metric reveals fascinating insights. From 2014 to 2023, American Airlines saw a 28% increase in its cost of revenue, peaking in 2023. This reflects the airline's strategic expansions and the challenges of rising fuel costs. Meanwhile, EMCOR Group experienced a 90% surge, highlighting its robust growth in infrastructure projects. Notably, 2020 marked a dip for American Airlines, likely due to the pandemic's impact, while EMCOR's steady climb underscores its resilience. These trends not only mirror the companies' trajectories but also offer a window into the broader economic shifts affecting their respective sectors.
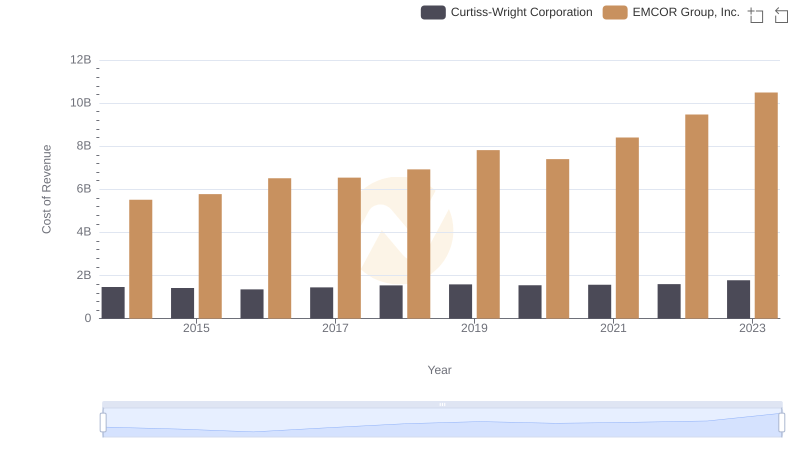
Comparing Cost of Revenue Efficiency: EMCOR Group, Inc. vs Curtiss-Wright Corporation
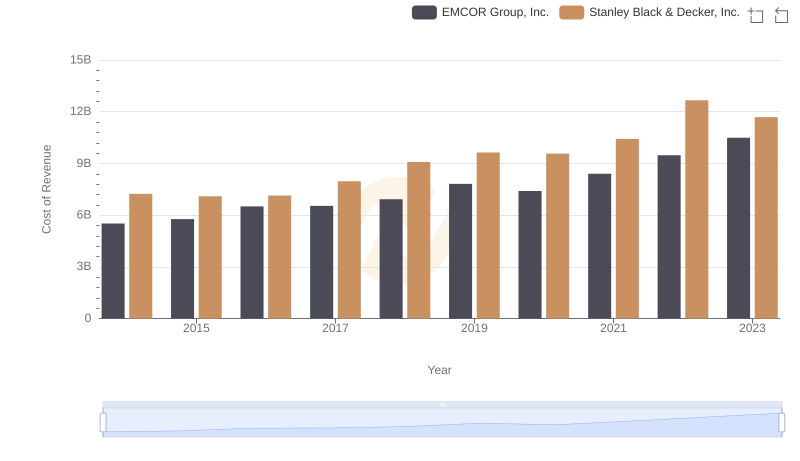
Cost of Revenue: Key Insights for EMCOR Group, Inc. and Stanley Black & Decker, Inc.
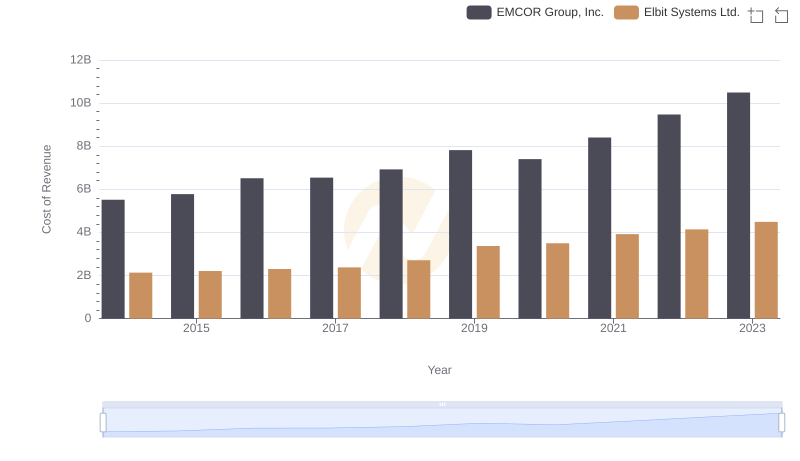
Cost of Revenue Trends: EMCOR Group, Inc. vs Elbit Systems Ltd.
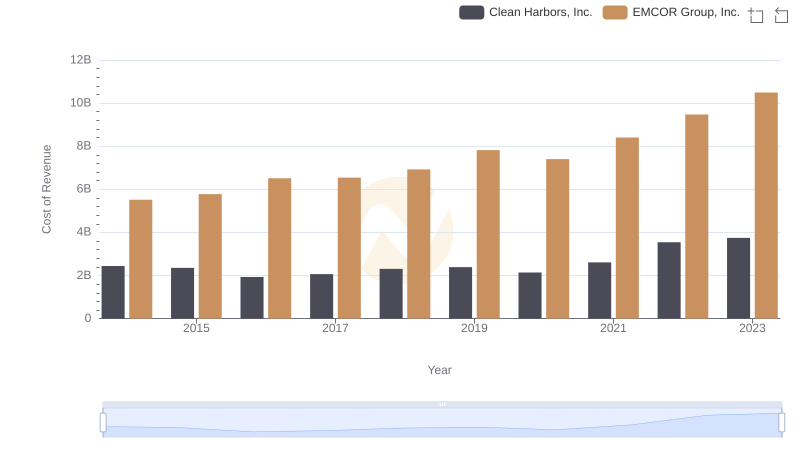
Cost of Revenue Trends: EMCOR Group, Inc. vs Clean Harbors, Inc.
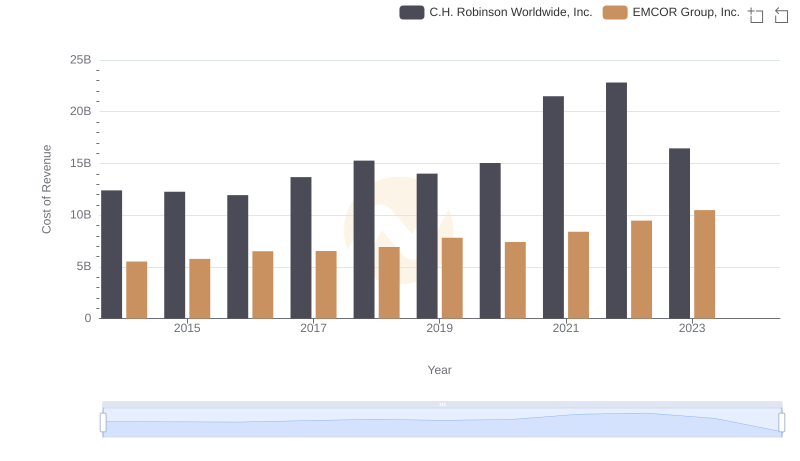
Cost of Revenue Comparison: EMCOR Group, Inc. vs C.H. Robinson Worldwide, Inc.
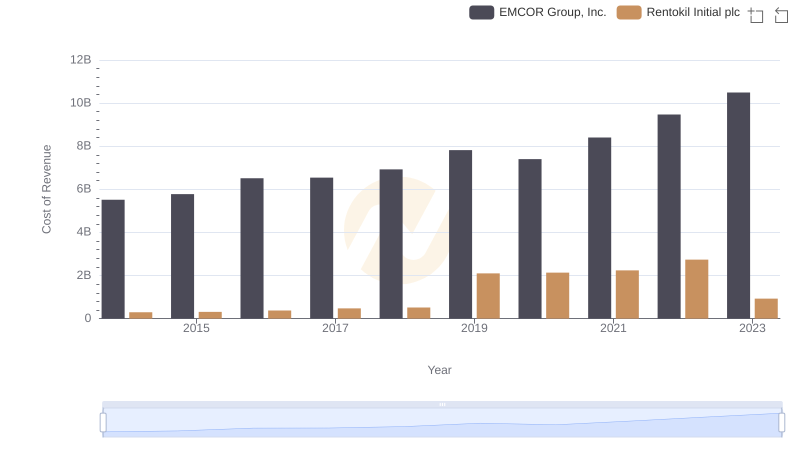
Analyzing Cost of Revenue: EMCOR Group, Inc. and Rentokil Initial plc
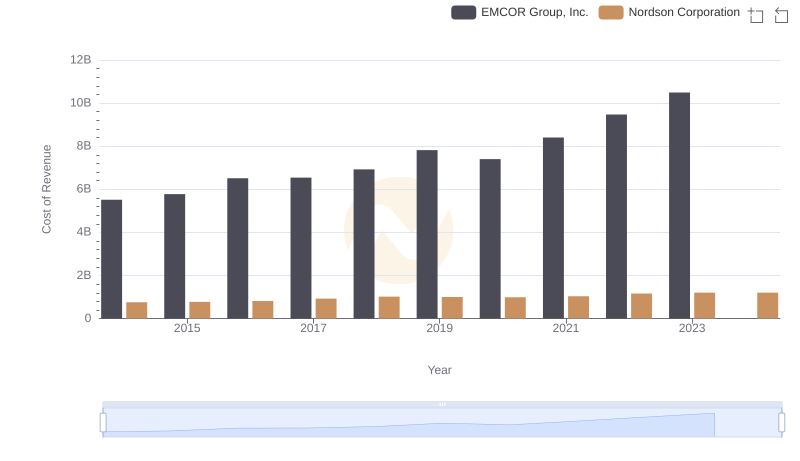
Cost of Revenue: Key Insights for EMCOR Group, Inc. and Nordson Corporation
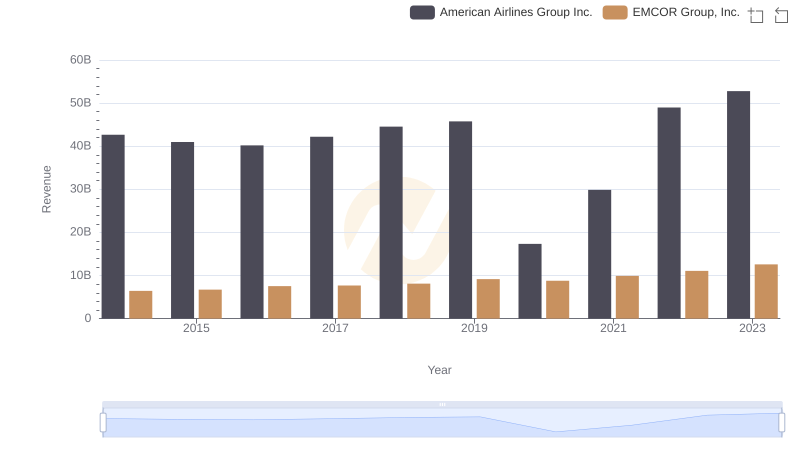
EMCOR Group, Inc. vs American Airlines Group Inc.: Examining Key Revenue Metrics
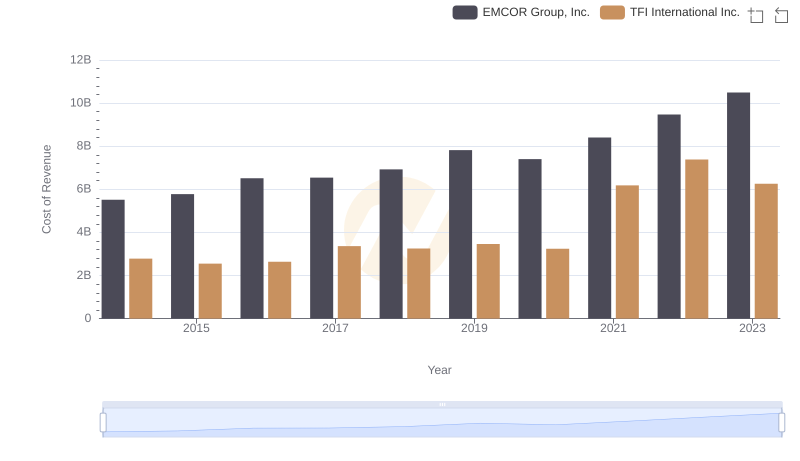
EMCOR Group, Inc. vs TFI International Inc.: Efficiency in Cost of Revenue Explored
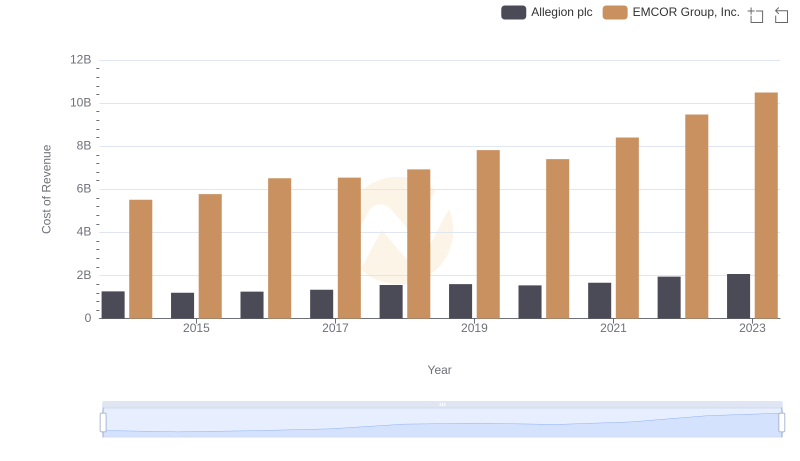
Cost Insights: Breaking Down EMCOR Group, Inc. and Allegion plc's Expenses