| __timestamp | China Eastern Airlines Corporation Limited | EMCOR Group, Inc. |
|---|---|---|
| Wednesday, January 1, 2014 | 78741000000 | 5517719000 |
| Thursday, January 1, 2015 | 77237000000 | 5774247000 |
| Friday, January 1, 2016 | 82676000000 | 6513662000 |
| Sunday, January 1, 2017 | 91592000000 | 6539987000 |
| Monday, January 1, 2018 | 103476000000 | 6925178000 |
| Tuesday, January 1, 2019 | 108865000000 | 7818743000 |
| Wednesday, January 1, 2020 | 72523000000 | 7401679000 |
| Friday, January 1, 2021 | 81828000000 | 8401843000 |
| Saturday, January 1, 2022 | 74599000000 | 9472526000 |
| Sunday, January 1, 2023 | 112461000000 | 10493534000 |
Unveiling the hidden dimensions of data
In the ever-evolving landscape of global business, understanding the cost of revenue is crucial for evaluating a company's operational efficiency. This analysis delves into the cost of revenue trends for EMCOR Group, Inc. and China Eastern Airlines Corporation Limited from 2014 to 2023.
Over the past decade, China Eastern Airlines has seen a fluctuating cost of revenue, peaking in 2023 with a 15% increase from its 2014 figures. This reflects the airline industry's volatile nature, influenced by global economic shifts and fuel price variations. In contrast, EMCOR Group, Inc. has demonstrated a steady upward trend, with a 90% increase in cost of revenue over the same period, highlighting its consistent growth in the construction and facilities services sector.
These insights underscore the diverse challenges and growth trajectories faced by companies in different industries, offering valuable lessons for investors and business strategists alike.
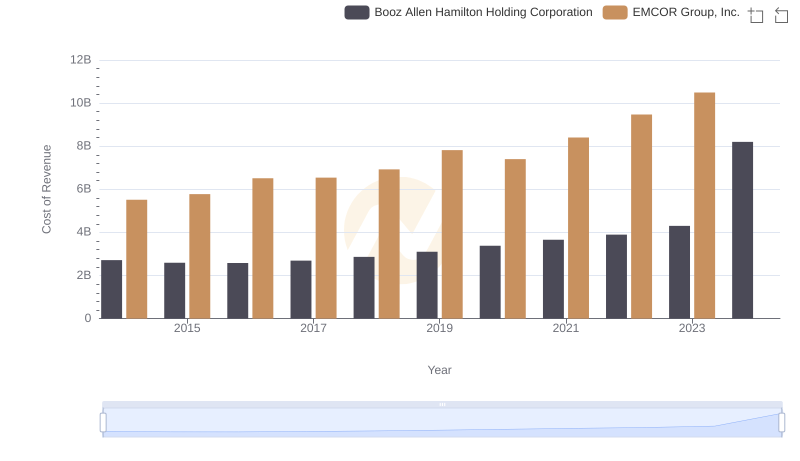
Cost of Revenue Trends: EMCOR Group, Inc. vs Booz Allen Hamilton Holding Corporation
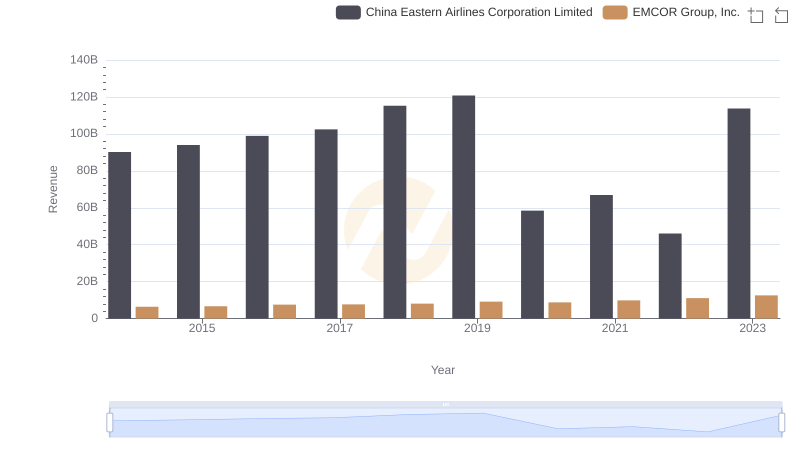
EMCOR Group, Inc. and China Eastern Airlines Corporation Limited: A Comprehensive Revenue Analysis
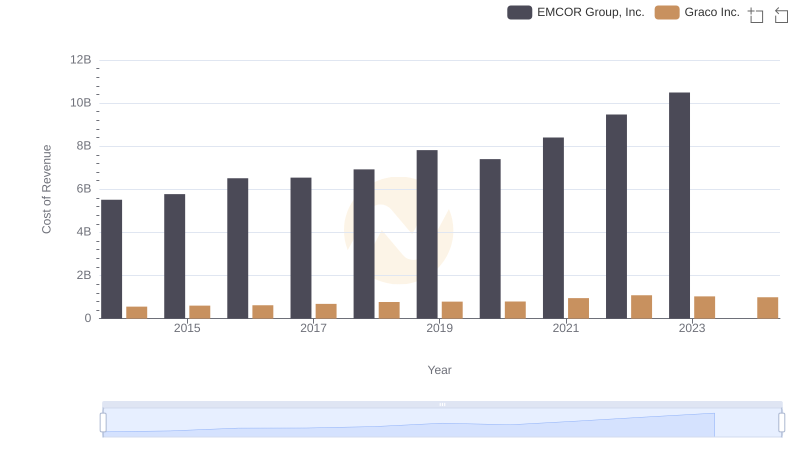
Cost of Revenue Trends: EMCOR Group, Inc. vs Graco Inc.
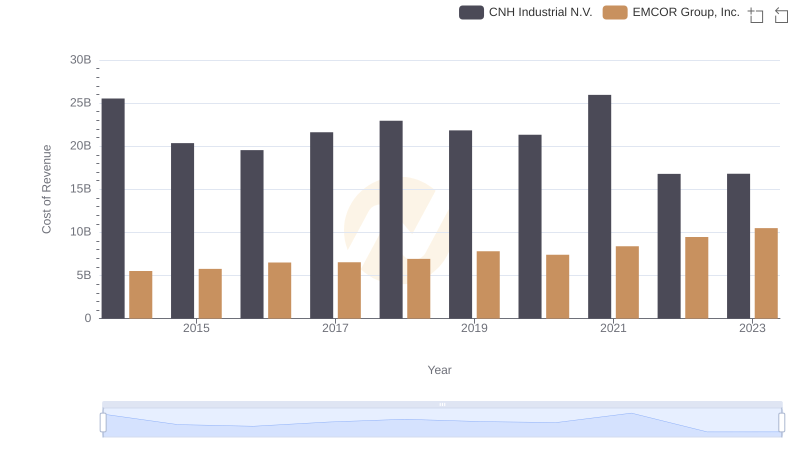
EMCOR Group, Inc. vs CNH Industrial N.V.: Efficiency in Cost of Revenue Explored
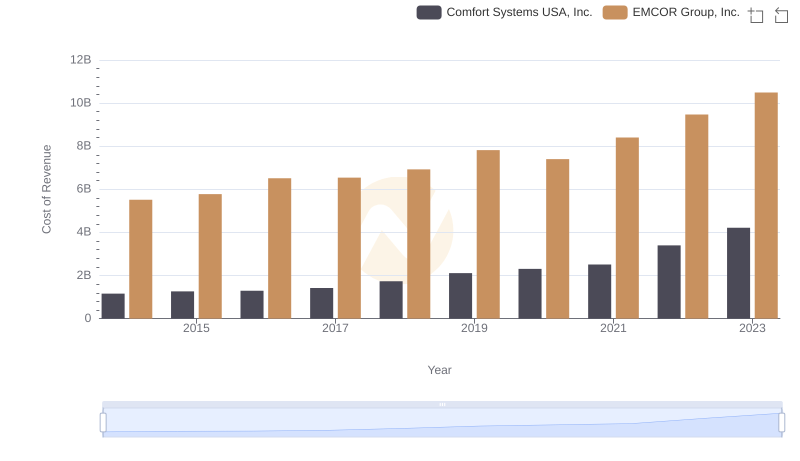
Cost of Revenue Trends: EMCOR Group, Inc. vs Comfort Systems USA, Inc.
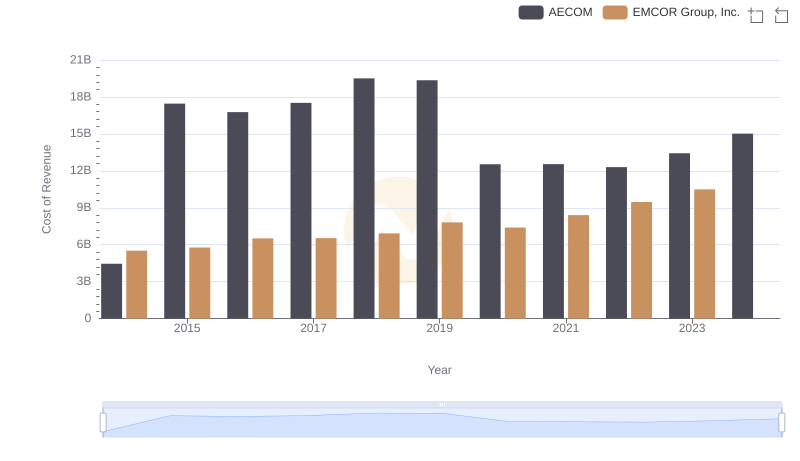
Cost of Revenue Trends: EMCOR Group, Inc. vs AECOM