| __timestamp | EMCOR Group, Inc. | Graco Inc. |
|---|---|---|
| Wednesday, January 1, 2014 | 5517719000 | 554394000 |
| Thursday, January 1, 2015 | 5774247000 | 601785000 |
| Friday, January 1, 2016 | 6513662000 | 621054000 |
| Sunday, January 1, 2017 | 6539987000 | 681695000 |
| Monday, January 1, 2018 | 6925178000 | 770753000 |
| Tuesday, January 1, 2019 | 7818743000 | 786289000 |
| Wednesday, January 1, 2020 | 7401679000 | 795178000 |
| Friday, January 1, 2021 | 8401843000 | 953659000 |
| Saturday, January 1, 2022 | 9472526000 | 1086082000 |
| Sunday, January 1, 2023 | 10493534000 | 1034585000 |
| Monday, January 1, 2024 | 990855000 |
Unleashing insights
In the competitive landscape of industrial services and manufacturing, EMCOR Group, Inc. and Graco Inc. have shown distinct trajectories in their cost of revenue from 2014 to 2023. EMCOR Group, Inc., a leader in mechanical and electrical construction services, has seen a robust growth of approximately 90% in its cost of revenue over the decade, reflecting its expanding operations and market reach. In contrast, Graco Inc., a prominent player in fluid handling systems, experienced a more modest increase of around 87% during the same period. This divergence highlights the varying strategies and market conditions faced by these industry giants. Notably, the data for 2024 is incomplete, leaving room for speculation on future trends. As these companies navigate the complexities of their respective industries, their cost of revenue trends offer valuable insights into their operational efficiencies and market dynamics.
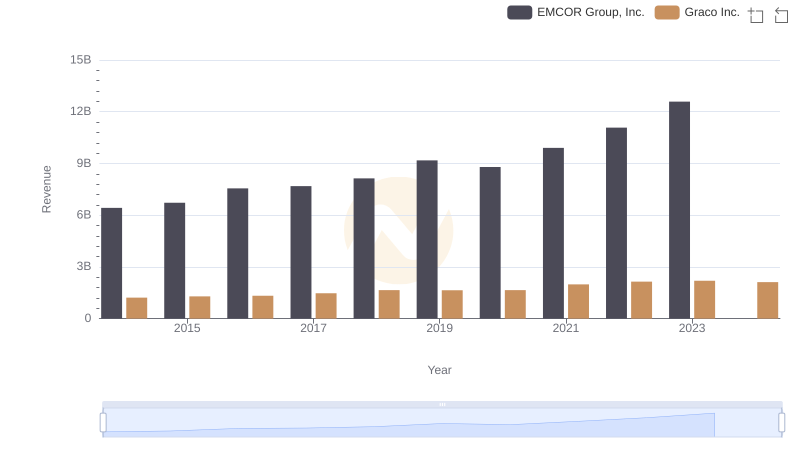
Annual Revenue Comparison: EMCOR Group, Inc. vs Graco Inc.
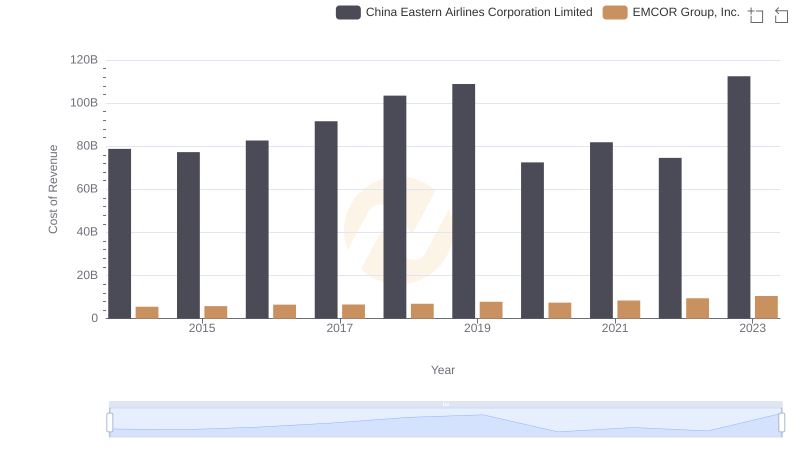
Cost of Revenue: Key Insights for EMCOR Group, Inc. and China Eastern Airlines Corporation Limited
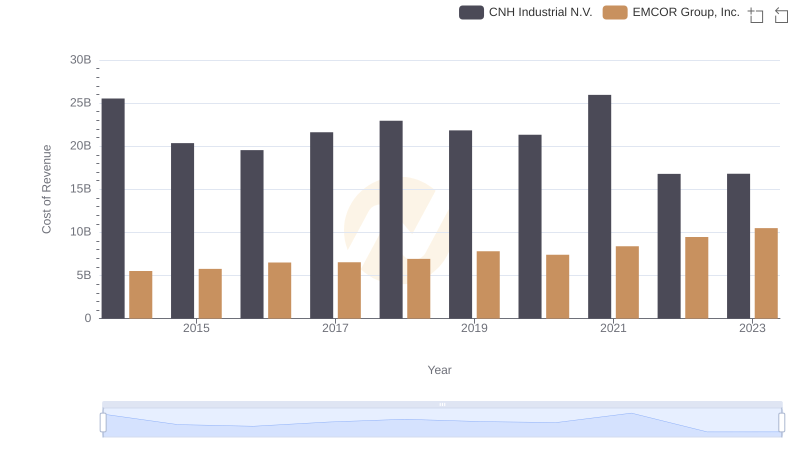
EMCOR Group, Inc. vs CNH Industrial N.V.: Efficiency in Cost of Revenue Explored
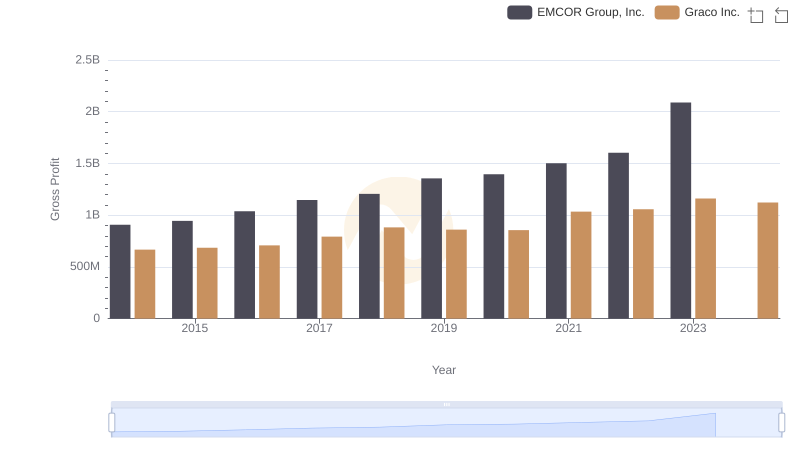
EMCOR Group, Inc. and Graco Inc.: A Detailed Gross Profit Analysis
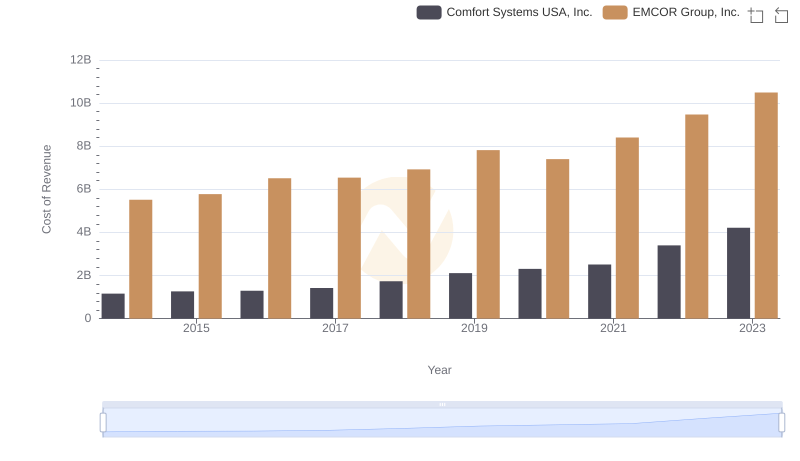
Cost of Revenue Trends: EMCOR Group, Inc. vs Comfort Systems USA, Inc.
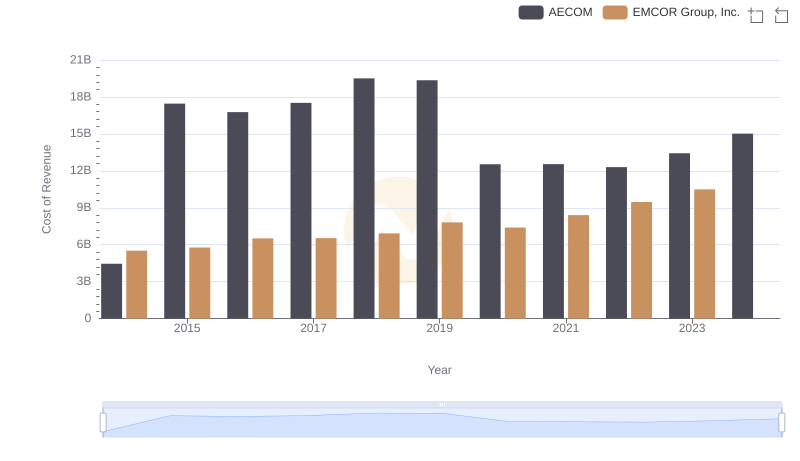
Cost of Revenue Trends: EMCOR Group, Inc. vs AECOM

Comparing Cost of Revenue Efficiency: EMCOR Group, Inc. vs Saia, Inc.
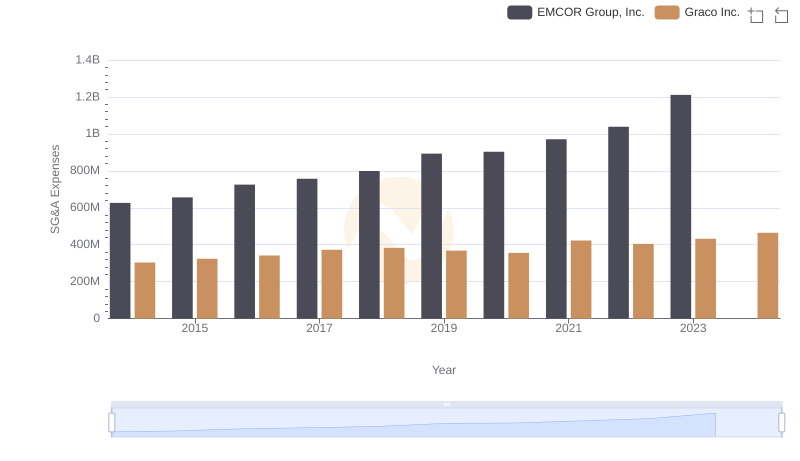
Breaking Down SG&A Expenses: EMCOR Group, Inc. vs Graco Inc.
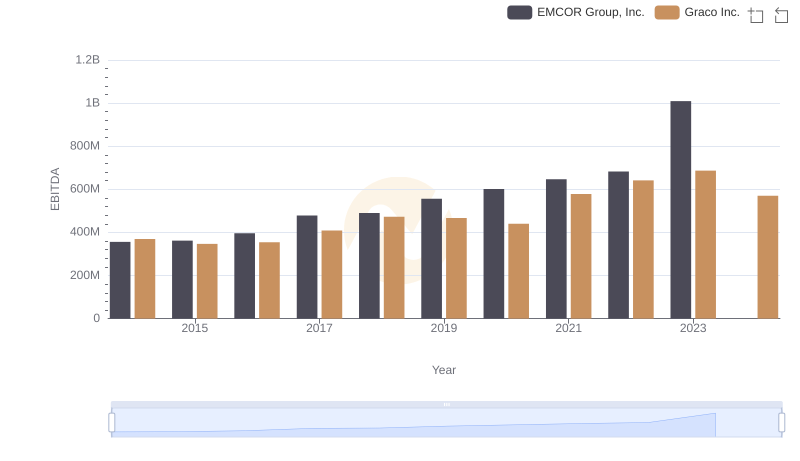
A Professional Review of EBITDA: EMCOR Group, Inc. Compared to Graco Inc.