| __timestamp | Comfort Systems USA, Inc. | EMCOR Group, Inc. |
|---|---|---|
| Wednesday, January 1, 2014 | 1161024000 | 5517719000 |
| Thursday, January 1, 2015 | 1262390000 | 5774247000 |
| Friday, January 1, 2016 | 1290331000 | 6513662000 |
| Sunday, January 1, 2017 | 1421641000 | 6539987000 |
| Monday, January 1, 2018 | 1736600000 | 6925178000 |
| Tuesday, January 1, 2019 | 2113334000 | 7818743000 |
| Wednesday, January 1, 2020 | 2309676000 | 7401679000 |
| Friday, January 1, 2021 | 2510429000 | 8401843000 |
| Saturday, January 1, 2022 | 3398756000 | 9472526000 |
| Sunday, January 1, 2023 | 4216251000 | 10493534000 |
Unveiling the hidden dimensions of data
In the competitive landscape of the construction and engineering sectors, EMCOR Group, Inc. and Comfort Systems USA, Inc. have emerged as significant players. Over the past decade, from 2014 to 2023, these companies have shown remarkable growth in their cost of revenue, reflecting their expanding operations and market influence.
EMCOR Group, Inc. has consistently outpaced Comfort Systems USA, Inc. in terms of cost of revenue, with a notable increase of approximately 90% from 2014 to 2023. Comfort Systems USA, Inc., while smaller in scale, has demonstrated a robust growth trajectory, with its cost of revenue nearly quadrupling over the same period.
This upward trend highlights the increasing demand for construction and engineering services in the United States, driven by infrastructure development and technological advancements. As these companies continue to grow, they set a benchmark for operational efficiency and market adaptability.
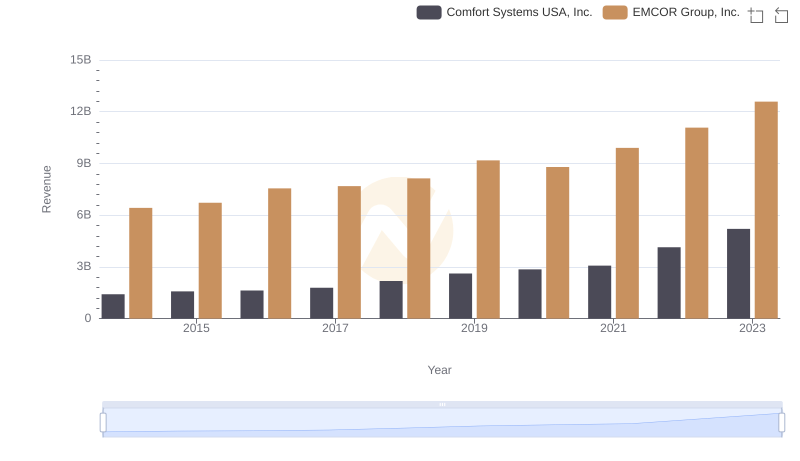
EMCOR Group, Inc. vs Comfort Systems USA, Inc.: Examining Key Revenue Metrics
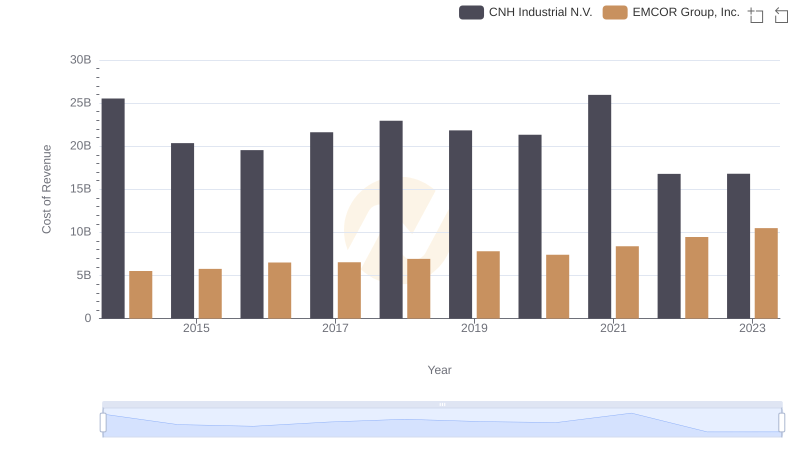
EMCOR Group, Inc. vs CNH Industrial N.V.: Efficiency in Cost of Revenue Explored
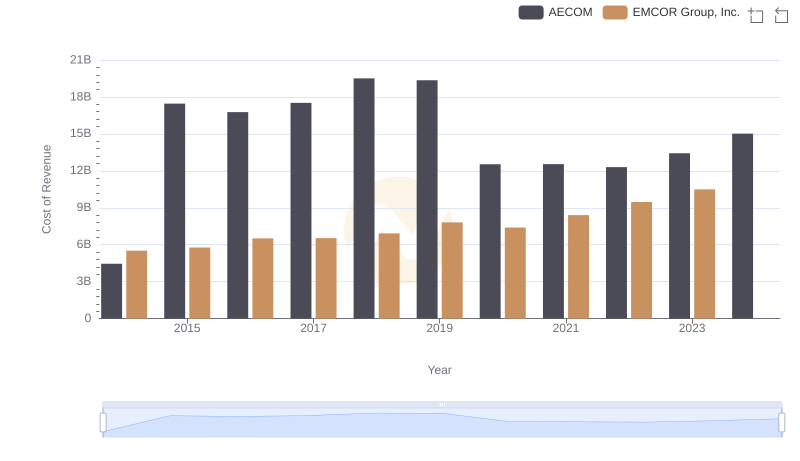
Cost of Revenue Trends: EMCOR Group, Inc. vs AECOM

Comparing Cost of Revenue Efficiency: EMCOR Group, Inc. vs Saia, Inc.
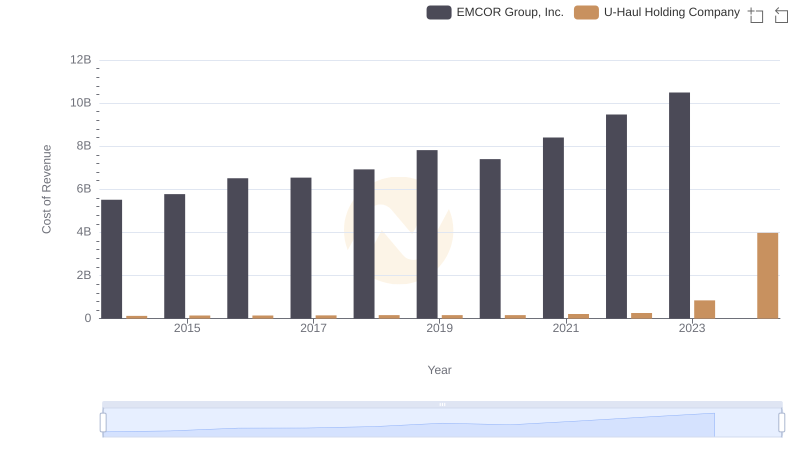
EMCOR Group, Inc. vs U-Haul Holding Company: Efficiency in Cost of Revenue Explored
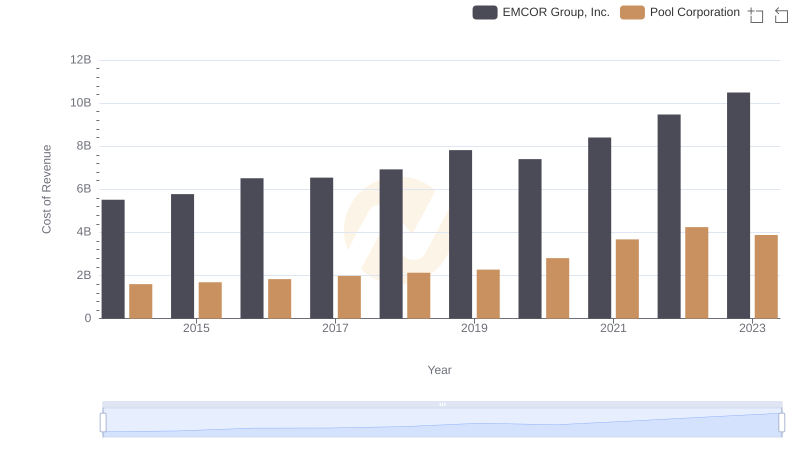
Cost of Revenue Comparison: EMCOR Group, Inc. vs Pool Corporation
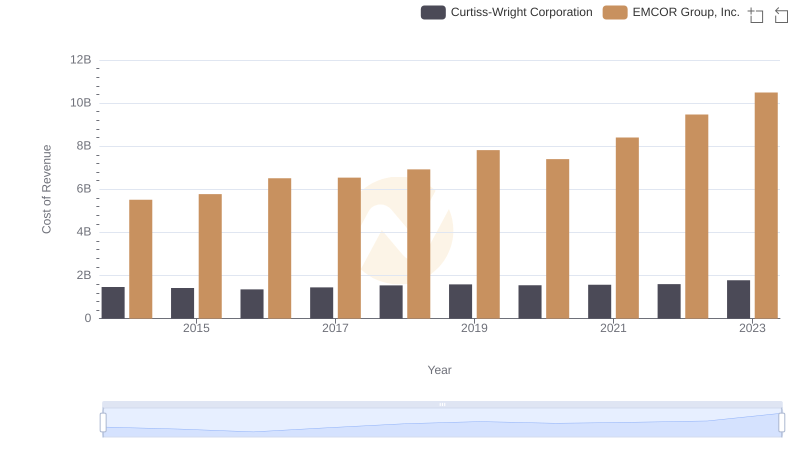
Comparing Cost of Revenue Efficiency: EMCOR Group, Inc. vs Curtiss-Wright Corporation
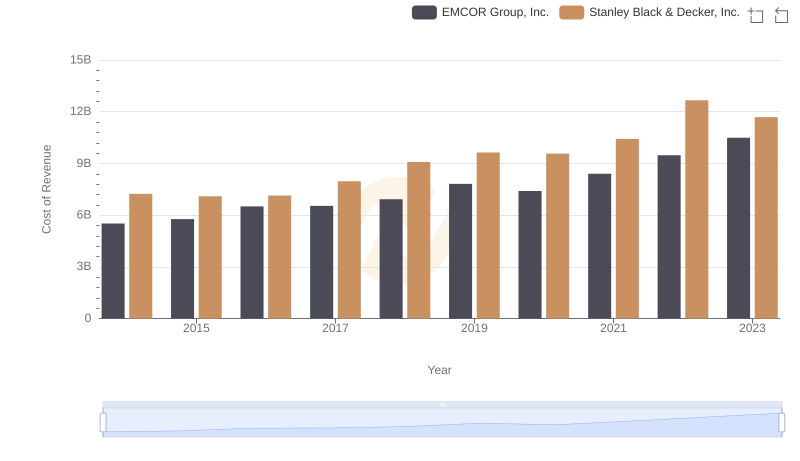
Cost of Revenue: Key Insights for EMCOR Group, Inc. and Stanley Black & Decker, Inc.
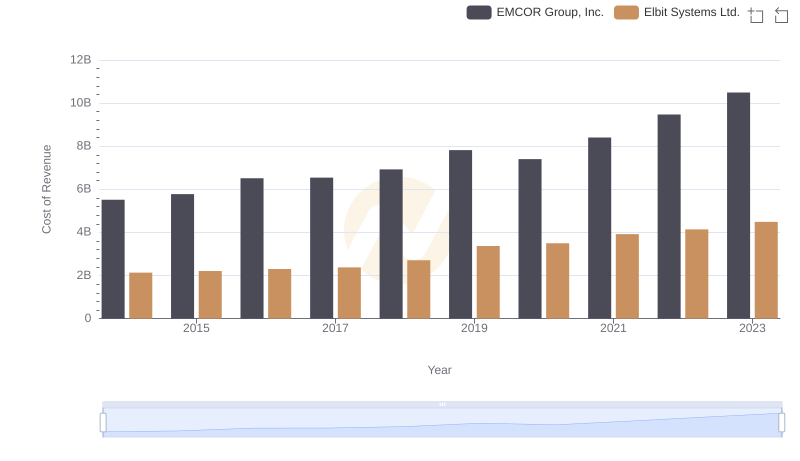
Cost of Revenue Trends: EMCOR Group, Inc. vs Elbit Systems Ltd.
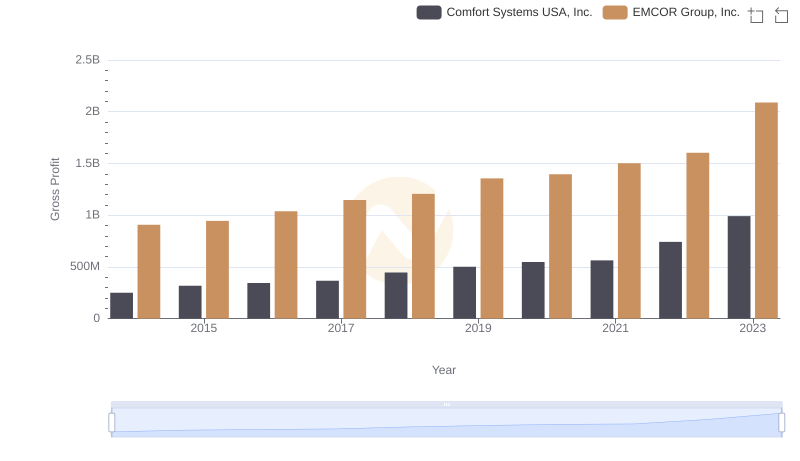
EMCOR Group, Inc. vs Comfort Systems USA, Inc.: A Gross Profit Performance Breakdown