| __timestamp | AECOM | EMCOR Group, Inc. |
|---|---|---|
| Wednesday, January 1, 2014 | 4452451000 | 5517719000 |
| Thursday, January 1, 2015 | 17454692000 | 5774247000 |
| Friday, January 1, 2016 | 16768001000 | 6513662000 |
| Sunday, January 1, 2017 | 17519682000 | 6539987000 |
| Monday, January 1, 2018 | 19504863000 | 6925178000 |
| Tuesday, January 1, 2019 | 19359884000 | 7818743000 |
| Wednesday, January 1, 2020 | 12530416000 | 7401679000 |
| Friday, January 1, 2021 | 12542431000 | 8401843000 |
| Saturday, January 1, 2022 | 12300208000 | 9472526000 |
| Sunday, January 1, 2023 | 13432996000 | 10493534000 |
| Monday, January 1, 2024 | 15021157000 |
In pursuit of knowledge
In the competitive landscape of engineering and construction, understanding cost dynamics is crucial. From 2014 to 2023, AECOM and EMCOR Group, Inc. have shown distinct trends in their cost of revenue. AECOM's cost of revenue peaked in 2018, reaching nearly 20% higher than its 2014 figures, before experiencing a dip in 2020. Meanwhile, EMCOR Group, Inc. demonstrated a steady increase, with a notable 90% rise from 2014 to 2023. This upward trajectory highlights EMCOR's strategic cost management and growth. However, data for 2024 is missing for EMCOR, leaving room for speculation on future trends. These insights provide a window into the financial strategies of two industry giants, offering valuable lessons for stakeholders and investors alike.
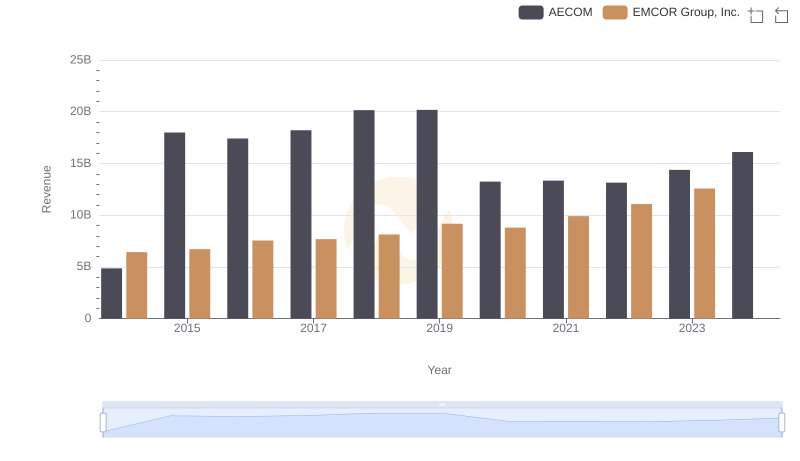
Revenue Insights: EMCOR Group, Inc. and AECOM Performance Compared
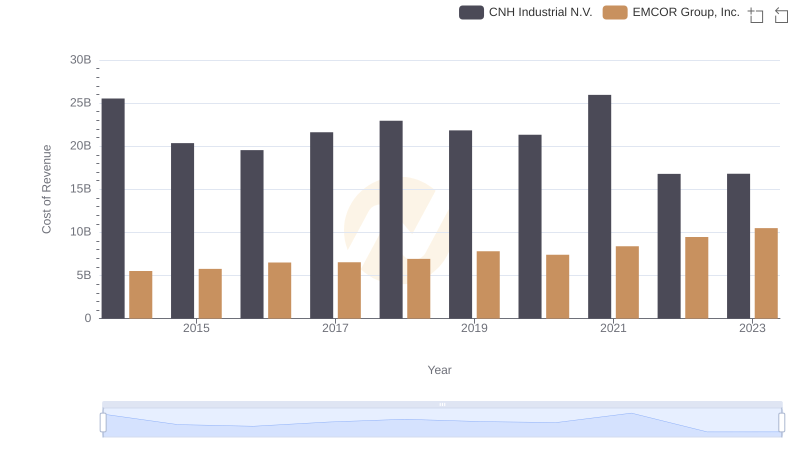
EMCOR Group, Inc. vs CNH Industrial N.V.: Efficiency in Cost of Revenue Explored
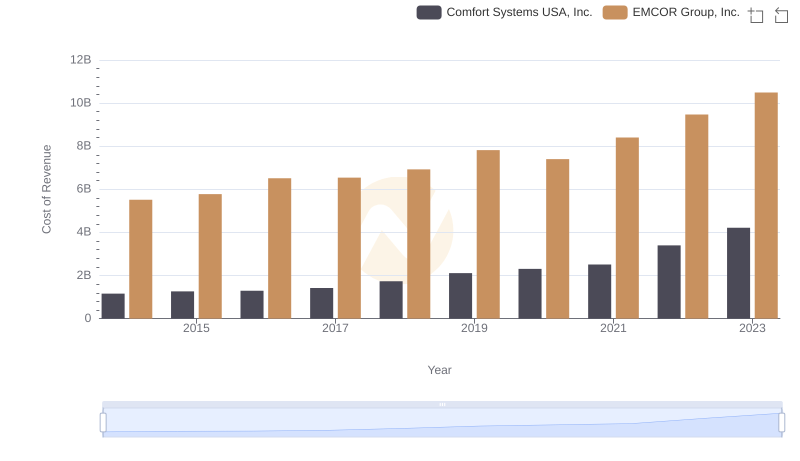
Cost of Revenue Trends: EMCOR Group, Inc. vs Comfort Systems USA, Inc.

Comparing Cost of Revenue Efficiency: EMCOR Group, Inc. vs Saia, Inc.
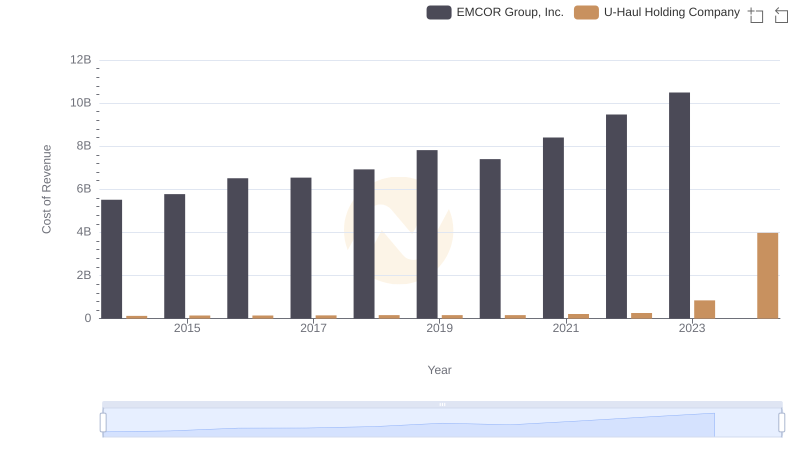
EMCOR Group, Inc. vs U-Haul Holding Company: Efficiency in Cost of Revenue Explored
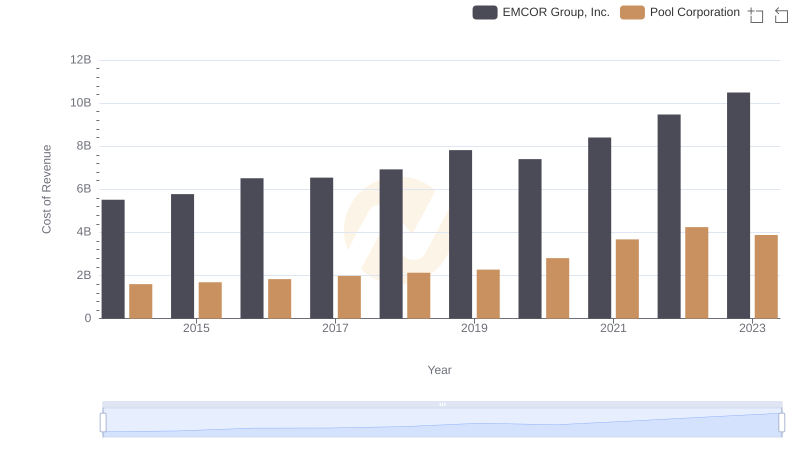
Cost of Revenue Comparison: EMCOR Group, Inc. vs Pool Corporation
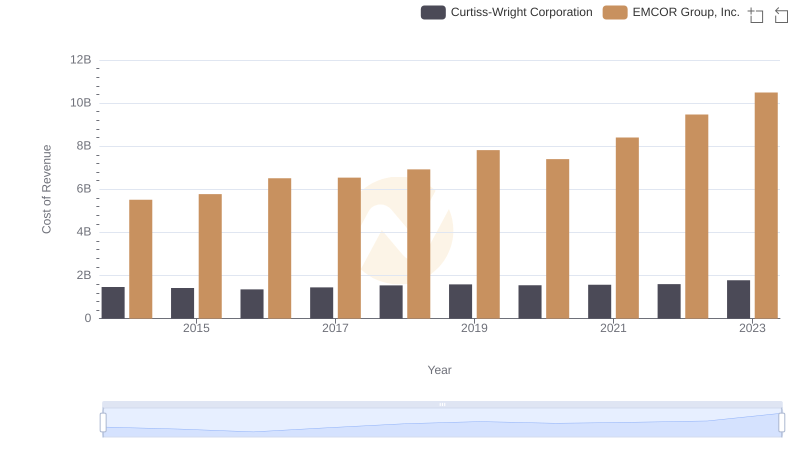
Comparing Cost of Revenue Efficiency: EMCOR Group, Inc. vs Curtiss-Wright Corporation
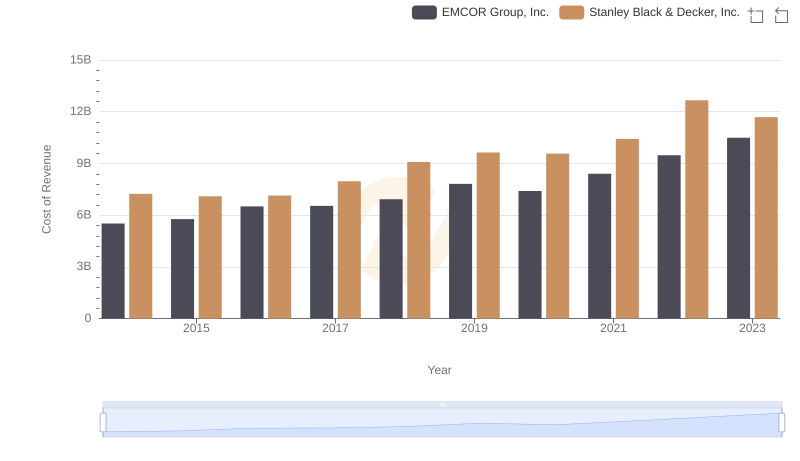
Cost of Revenue: Key Insights for EMCOR Group, Inc. and Stanley Black & Decker, Inc.
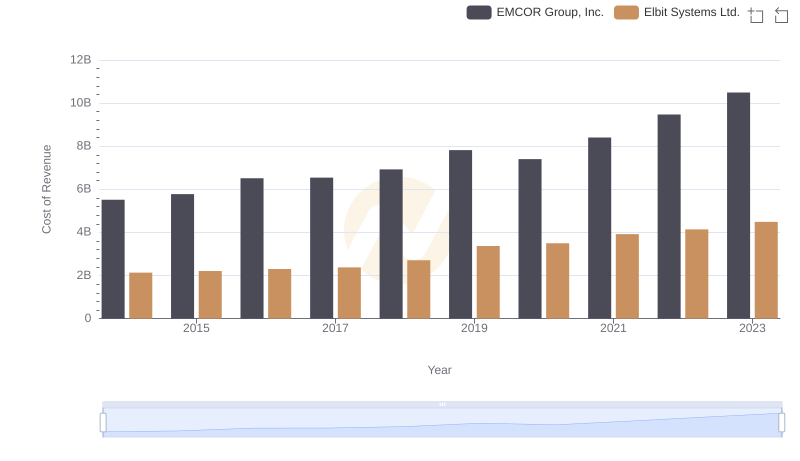
Cost of Revenue Trends: EMCOR Group, Inc. vs Elbit Systems Ltd.
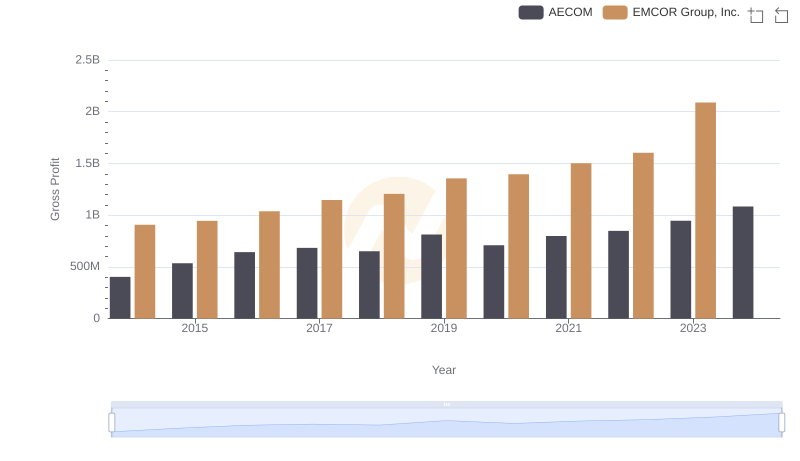
Who Generates Higher Gross Profit? EMCOR Group, Inc. or AECOM
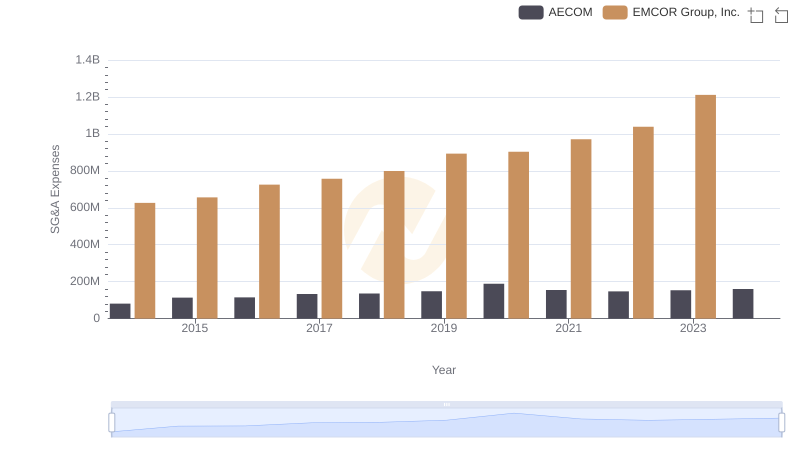
Comparing SG&A Expenses: EMCOR Group, Inc. vs AECOM Trends and Insights
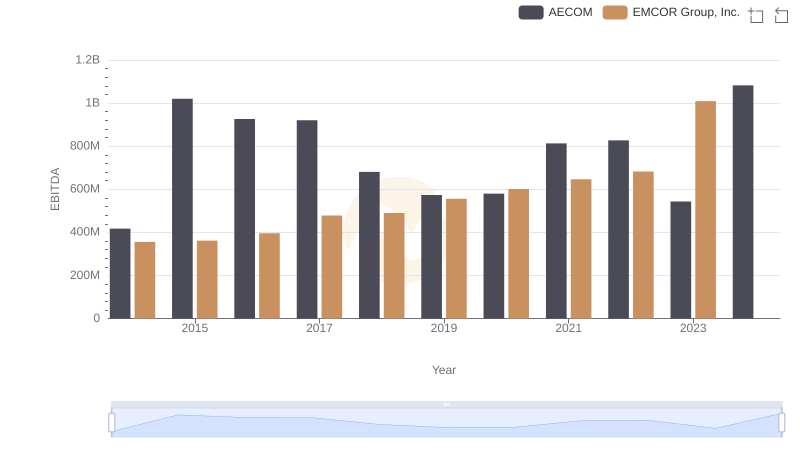
Comprehensive EBITDA Comparison: EMCOR Group, Inc. vs AECOM