| __timestamp | EMCOR Group, Inc. | Graco Inc. |
|---|---|---|
| Wednesday, January 1, 2014 | 6424965000 | 1221130000 |
| Thursday, January 1, 2015 | 6718726000 | 1286485000 |
| Friday, January 1, 2016 | 7551524000 | 1329293000 |
| Sunday, January 1, 2017 | 7686999000 | 1474744000 |
| Monday, January 1, 2018 | 8130631000 | 1653292000 |
| Tuesday, January 1, 2019 | 9174611000 | 1646045000 |
| Wednesday, January 1, 2020 | 8797061000 | 1650115000 |
| Friday, January 1, 2021 | 9903580000 | 1987608000 |
| Saturday, January 1, 2022 | 11076120000 | 2143521000 |
| Sunday, January 1, 2023 | 12582873000 | 2195606000 |
| Monday, January 1, 2024 | 2113316000 |
Unleashing the power of data
In the competitive landscape of industrial services and manufacturing, EMCOR Group, Inc. and Graco Inc. have carved out significant niches. Over the past decade, EMCOR has demonstrated a robust growth trajectory, with its revenue surging by nearly 96% from 2014 to 2023. This impressive growth reflects EMCOR's strategic expansions and market adaptability. In contrast, Graco Inc., a leader in fluid handling systems, has seen a steady revenue increase of approximately 80% over the same period. While EMCOR's revenue in 2023 reached a peak, Graco's consistent performance underscores its resilience in a fluctuating market. Notably, the data for 2024 is incomplete, leaving room for speculation on future trends. As these industry giants continue to evolve, their financial narratives offer valuable insights into the broader economic landscape.
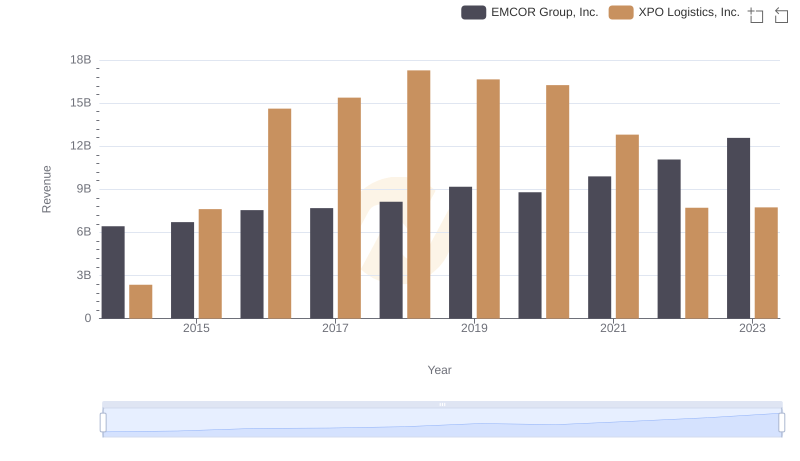
Annual Revenue Comparison: EMCOR Group, Inc. vs XPO Logistics, Inc.
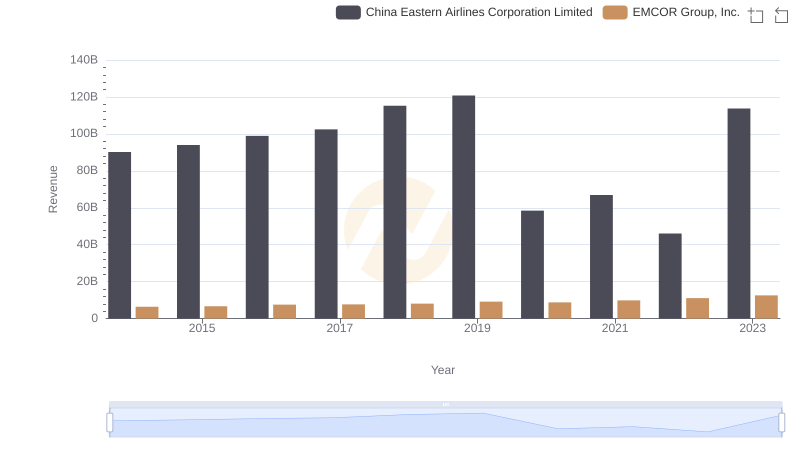
EMCOR Group, Inc. and China Eastern Airlines Corporation Limited: A Comprehensive Revenue Analysis
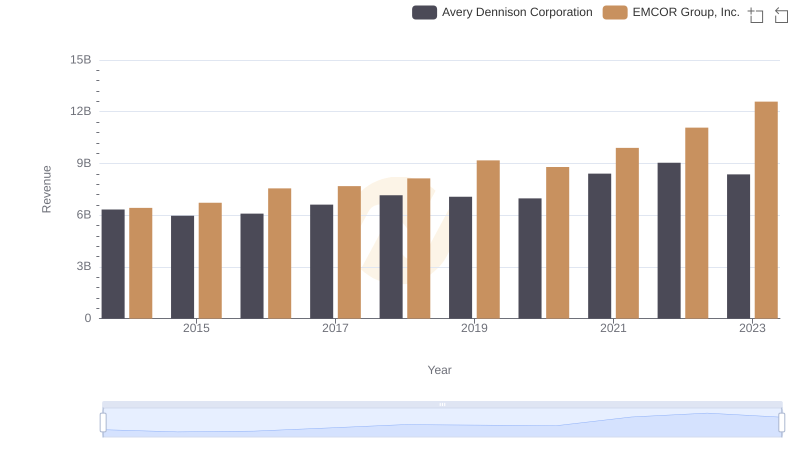
Comparing Revenue Performance: EMCOR Group, Inc. or Avery Dennison Corporation?
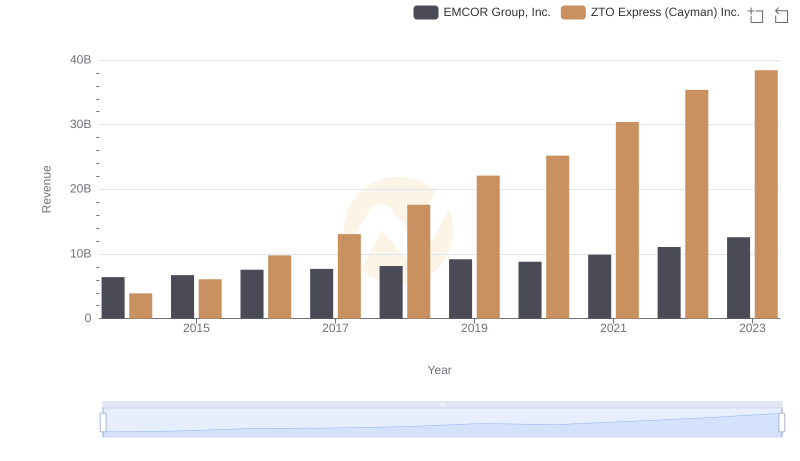
Breaking Down Revenue Trends: EMCOR Group, Inc. vs ZTO Express (Cayman) Inc.
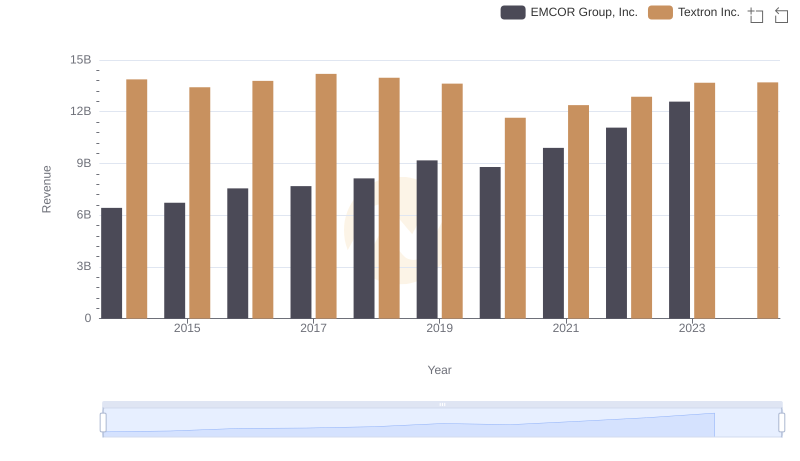
Who Generates More Revenue? EMCOR Group, Inc. or Textron Inc.
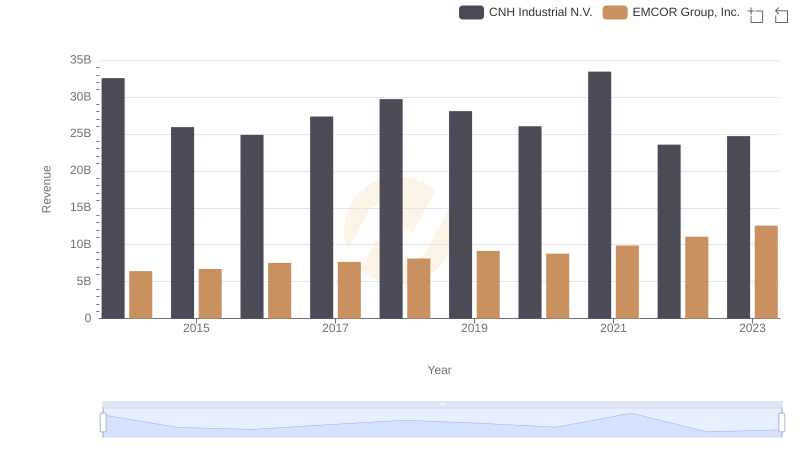
Comparing Revenue Performance: EMCOR Group, Inc. or CNH Industrial N.V.?
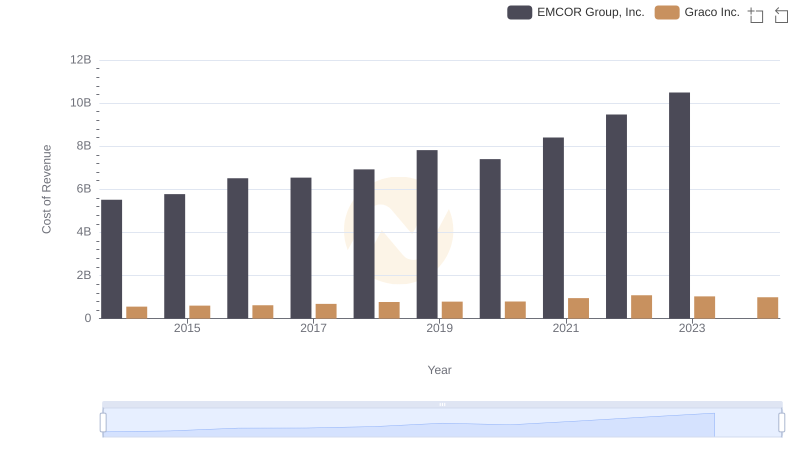
Cost of Revenue Trends: EMCOR Group, Inc. vs Graco Inc.
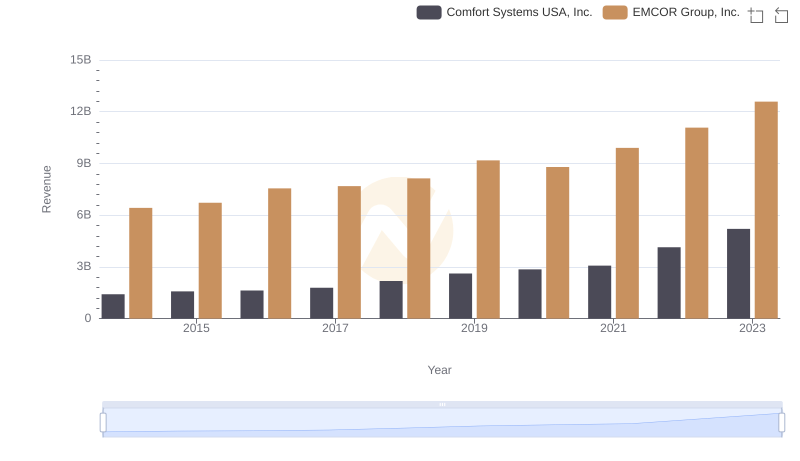
EMCOR Group, Inc. vs Comfort Systems USA, Inc.: Examining Key Revenue Metrics
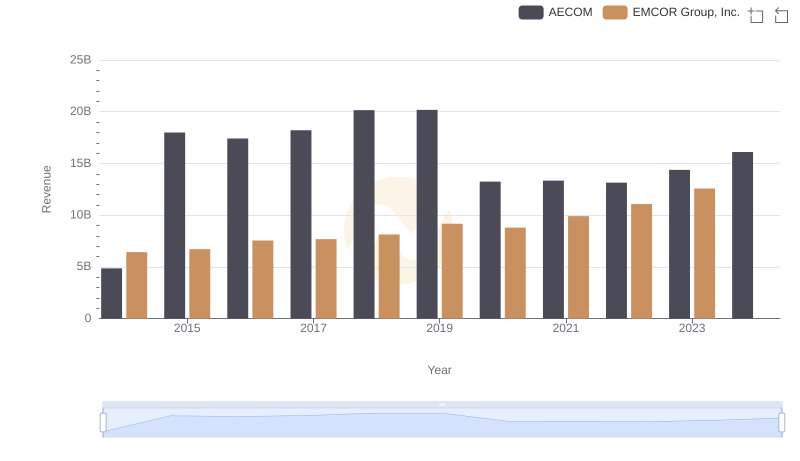
Revenue Insights: EMCOR Group, Inc. and AECOM Performance Compared
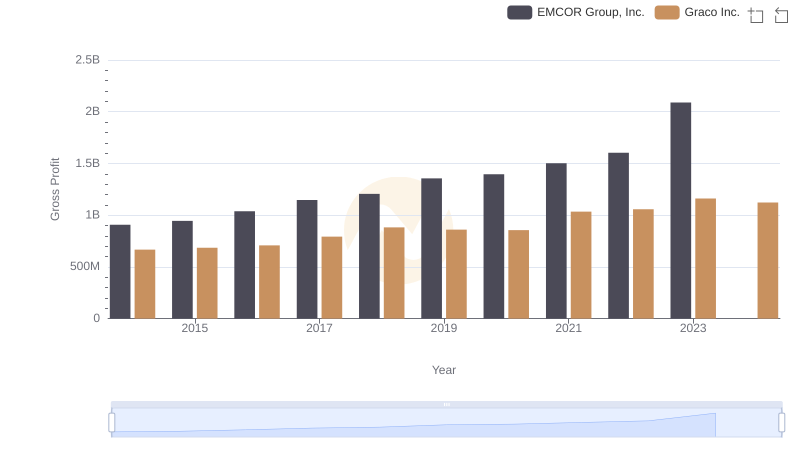
EMCOR Group, Inc. and Graco Inc.: A Detailed Gross Profit Analysis
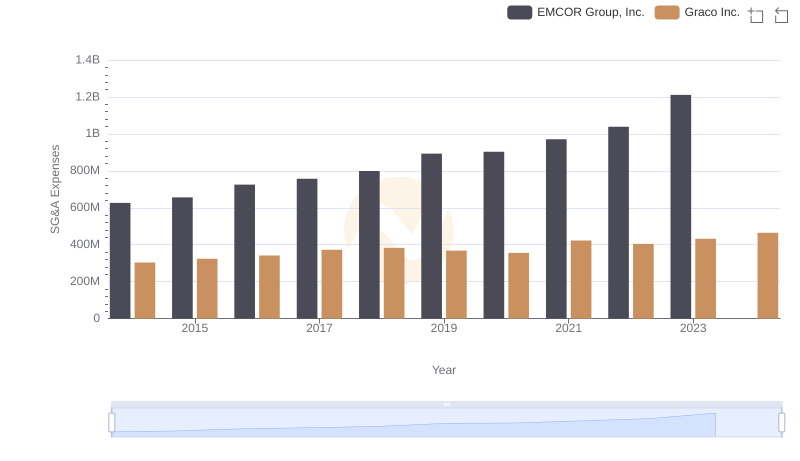
Breaking Down SG&A Expenses: EMCOR Group, Inc. vs Graco Inc.
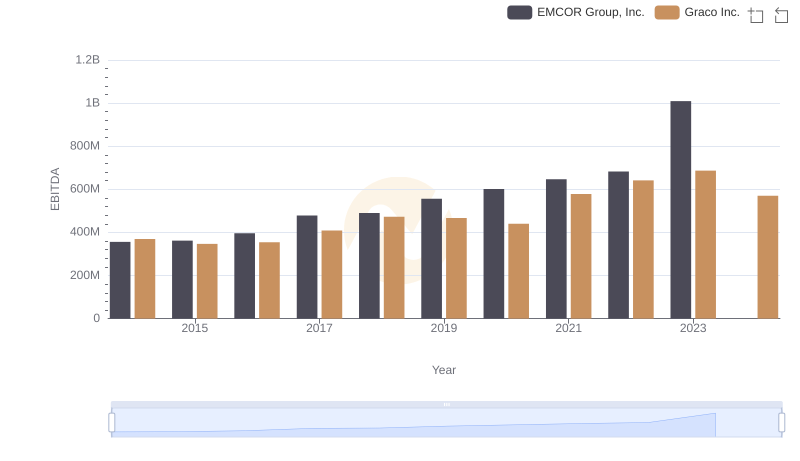
A Professional Review of EBITDA: EMCOR Group, Inc. Compared to Graco Inc.