| __timestamp | EMCOR Group, Inc. | Graco Inc. |
|---|---|---|
| Wednesday, January 1, 2014 | 626478000 | 303565000 |
| Thursday, January 1, 2015 | 656573000 | 324016000 |
| Friday, January 1, 2016 | 725538000 | 341734000 |
| Sunday, January 1, 2017 | 757062000 | 372496000 |
| Monday, January 1, 2018 | 799157000 | 382988000 |
| Tuesday, January 1, 2019 | 893453000 | 367743000 |
| Wednesday, January 1, 2020 | 903584000 | 355796000 |
| Friday, January 1, 2021 | 970937000 | 422975000 |
| Saturday, January 1, 2022 | 1038717000 | 404731000 |
| Sunday, January 1, 2023 | 1211233000 | 432156000 |
| Monday, January 1, 2024 | 465133000 |
Data in motion
In the ever-evolving landscape of corporate finance, understanding the nuances of Selling, General, and Administrative (SG&A) expenses is crucial. Over the past decade, EMCOR Group, Inc. and Graco Inc. have showcased distinct trajectories in their SG&A expenditures. From 2014 to 2023, EMCOR's SG&A expenses surged by approximately 93%, reflecting its strategic investments and operational expansions. In contrast, Graco Inc. experienced a more modest increase of around 42% during the same period, indicating a steady yet cautious approach to growth.
The year 2023 marked a significant milestone for EMCOR, with SG&A expenses peaking at over $1.2 billion, while Graco's expenses reached approximately $432 million. This divergence highlights the contrasting business strategies and market positions of these two industry players. Notably, data for 2024 is incomplete, suggesting potential shifts in future trends. As businesses navigate the complexities of financial management, these insights offer valuable lessons in balancing growth and efficiency.
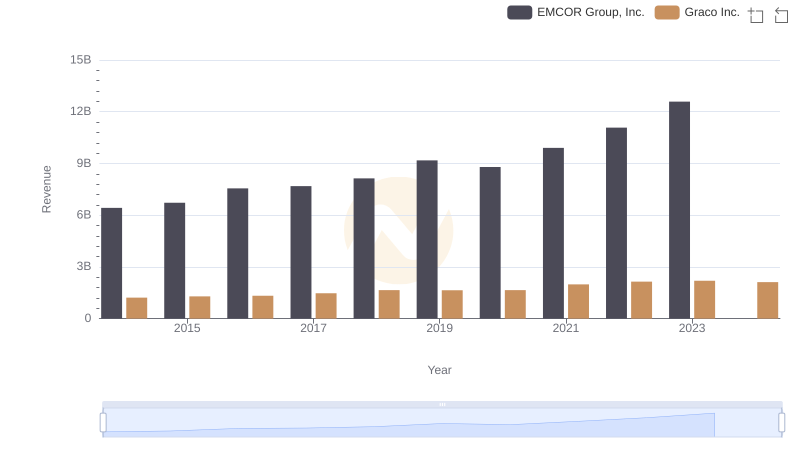
Annual Revenue Comparison: EMCOR Group, Inc. vs Graco Inc.
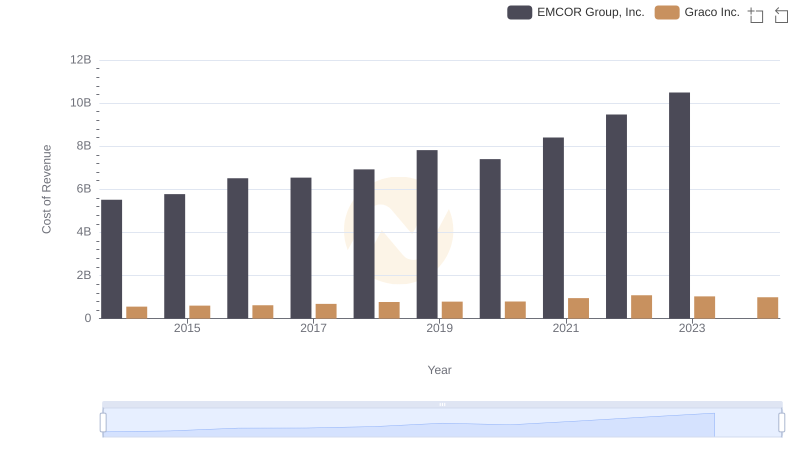
Cost of Revenue Trends: EMCOR Group, Inc. vs Graco Inc.
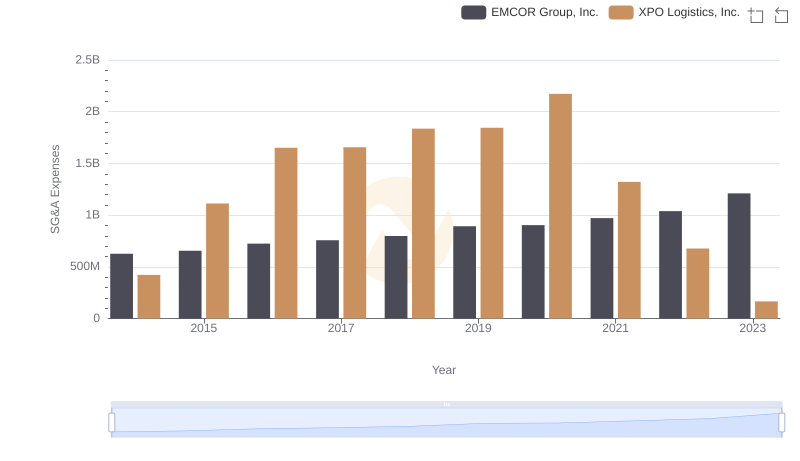
Selling, General, and Administrative Costs: EMCOR Group, Inc. vs XPO Logistics, Inc.
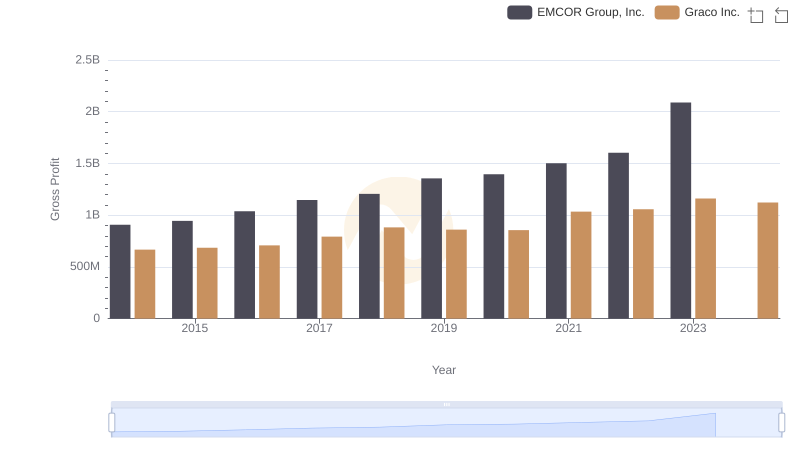
EMCOR Group, Inc. and Graco Inc.: A Detailed Gross Profit Analysis
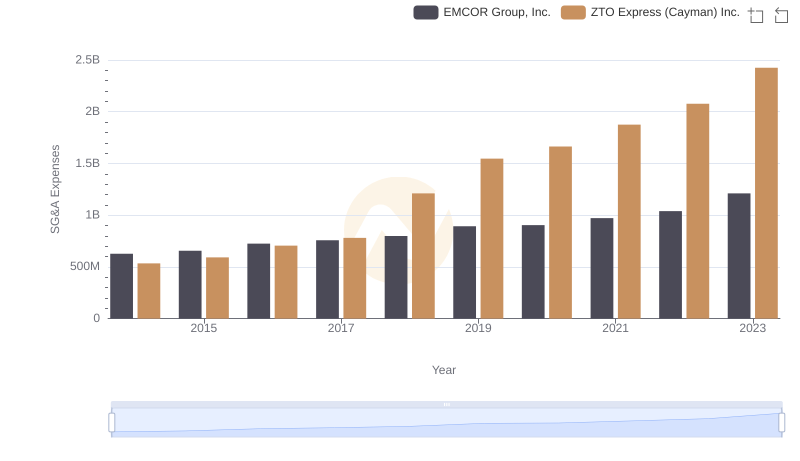
Comparing SG&A Expenses: EMCOR Group, Inc. vs ZTO Express (Cayman) Inc. Trends and Insights
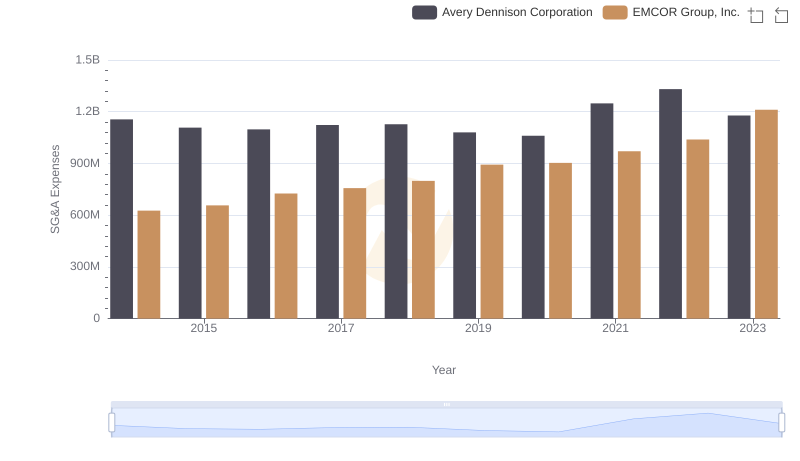
Breaking Down SG&A Expenses: EMCOR Group, Inc. vs Avery Dennison Corporation
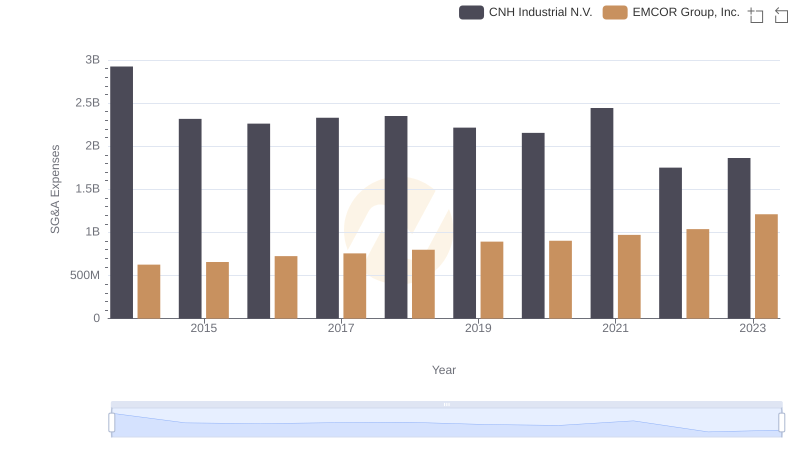
EMCOR Group, Inc. or CNH Industrial N.V.: Who Manages SG&A Costs Better?
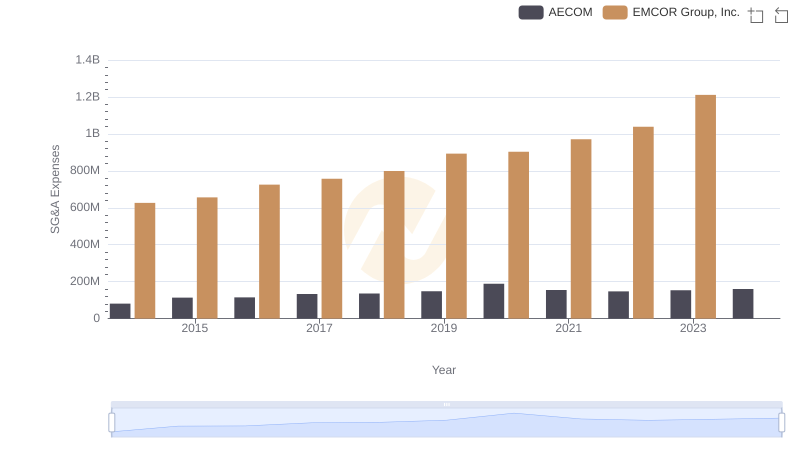
Comparing SG&A Expenses: EMCOR Group, Inc. vs AECOM Trends and Insights
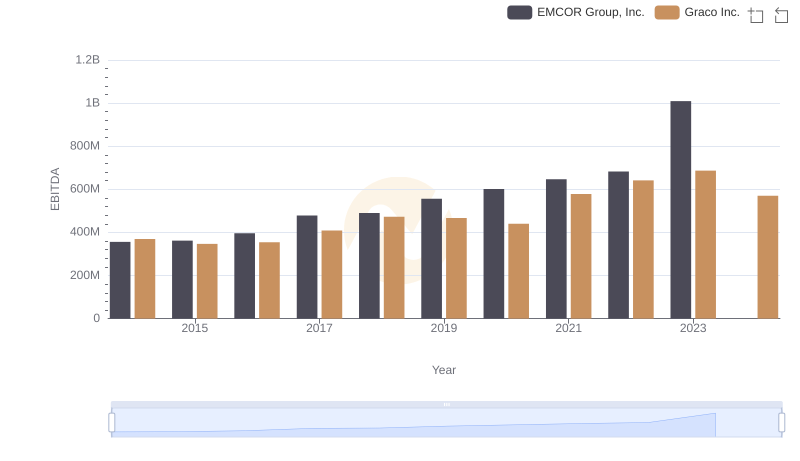
A Professional Review of EBITDA: EMCOR Group, Inc. Compared to Graco Inc.
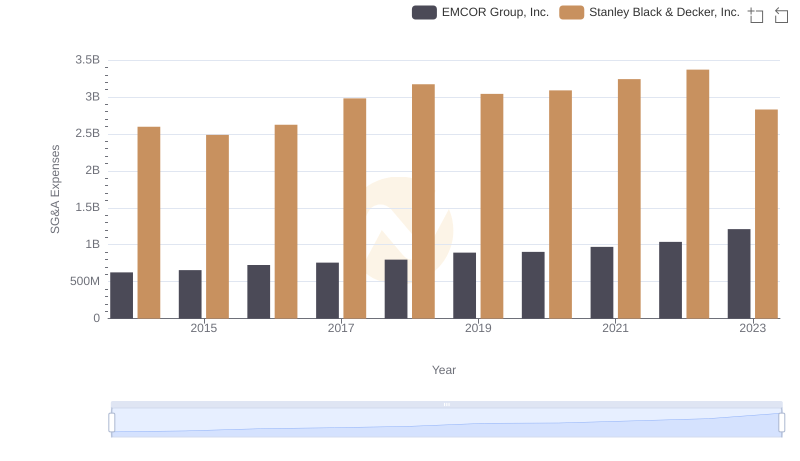
Selling, General, and Administrative Costs: EMCOR Group, Inc. vs Stanley Black & Decker, Inc.