| __timestamp | Lennox International Inc. | United Rentals, Inc. |
|---|---|---|
| Wednesday, January 1, 2014 | 3367400000 | 5685000000 |
| Thursday, January 1, 2015 | 3467400000 | 5817000000 |
| Friday, January 1, 2016 | 3641600000 | 5762000000 |
| Sunday, January 1, 2017 | 3839600000 | 6641000000 |
| Monday, January 1, 2018 | 3883900000 | 8047000000 |
| Tuesday, January 1, 2019 | 3807200000 | 9351000000 |
| Wednesday, January 1, 2020 | 3634100000 | 8530000000 |
| Friday, January 1, 2021 | 4194100000 | 9716000000 |
| Saturday, January 1, 2022 | 4718400000 | 11642000000 |
| Sunday, January 1, 2023 | 4981900000 | 14332000000 |
| Monday, January 1, 2024 | 5341300000 | 15345000000 |
Unleashing the power of data
In the ever-evolving landscape of industrial growth, United Rentals, Inc. and Lennox International Inc. have emerged as formidable players. Over the past decade, from 2014 to 2024, these companies have showcased remarkable revenue trajectories. United Rentals, Inc. has seen its revenue soar by approximately 170%, reflecting its strategic expansions and market adaptability. In contrast, Lennox International Inc. has experienced a steady growth of around 60%, underscoring its resilience and consistent market presence.
This comparison not only highlights the dynamic nature of these companies but also offers a glimpse into the broader industrial sector's growth patterns.
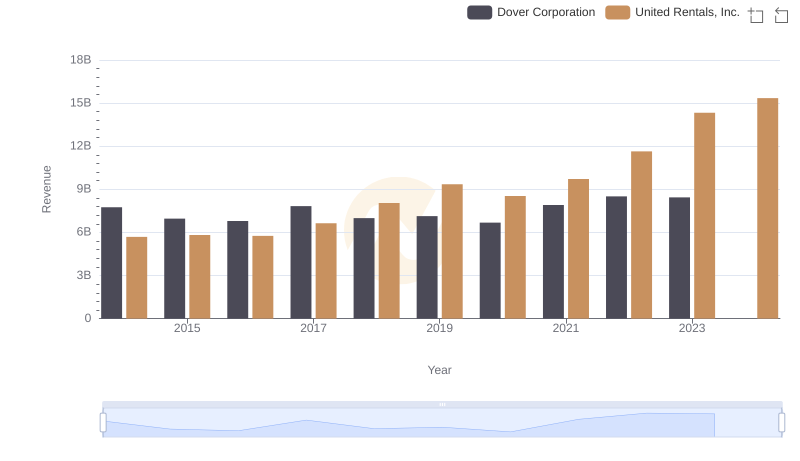
United Rentals, Inc. or Dover Corporation: Who Leads in Yearly Revenue?
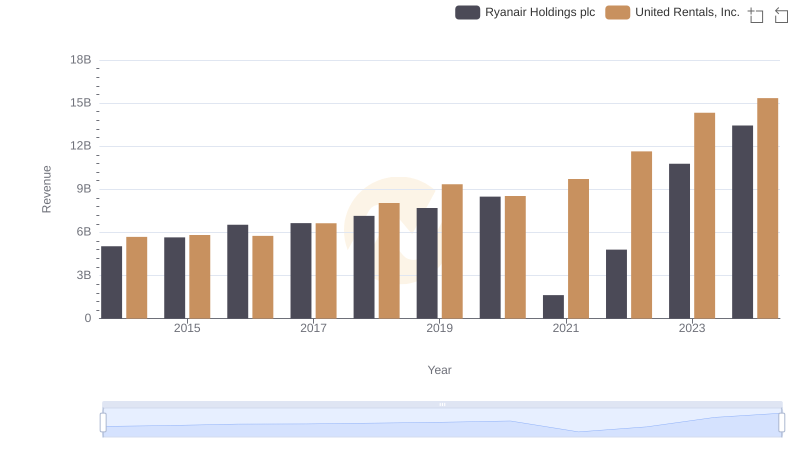
Revenue Insights: United Rentals, Inc. and Ryanair Holdings plc Performance Compared
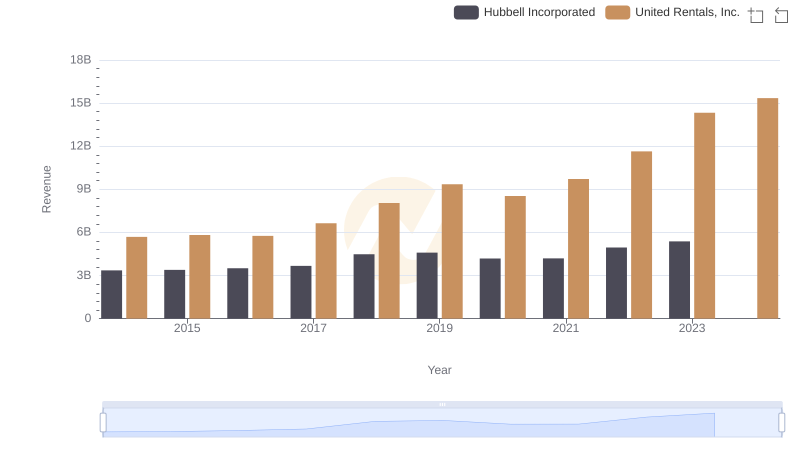
Revenue Showdown: United Rentals, Inc. vs Hubbell Incorporated
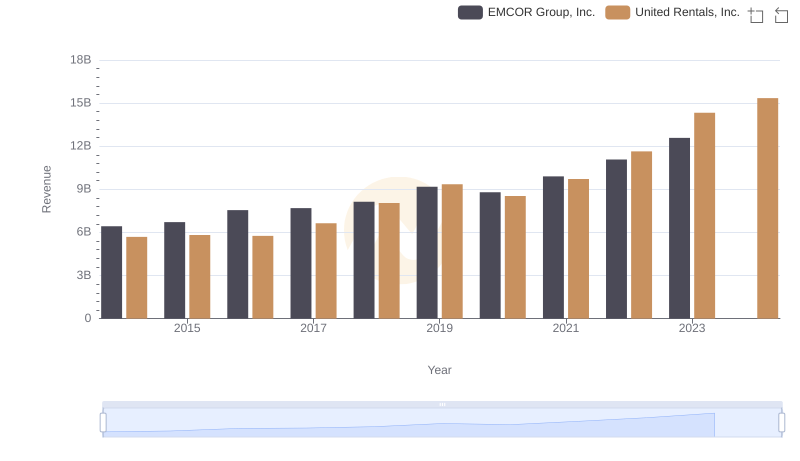
United Rentals, Inc. vs EMCOR Group, Inc.: Examining Key Revenue Metrics
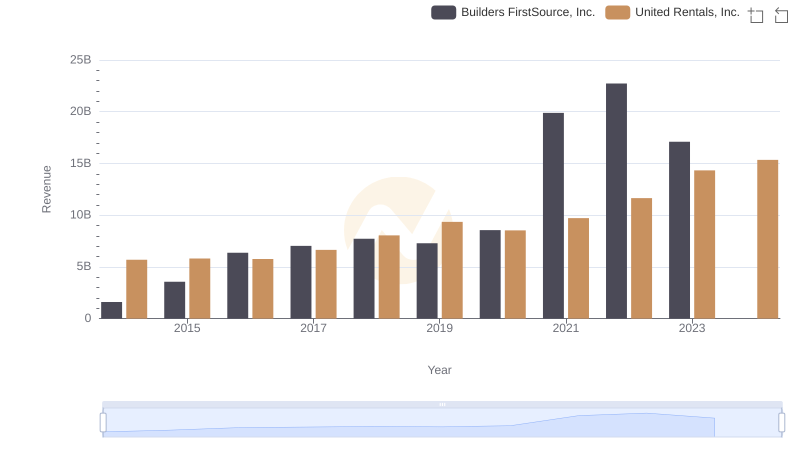
United Rentals, Inc. or Builders FirstSource, Inc.: Who Leads in Yearly Revenue?
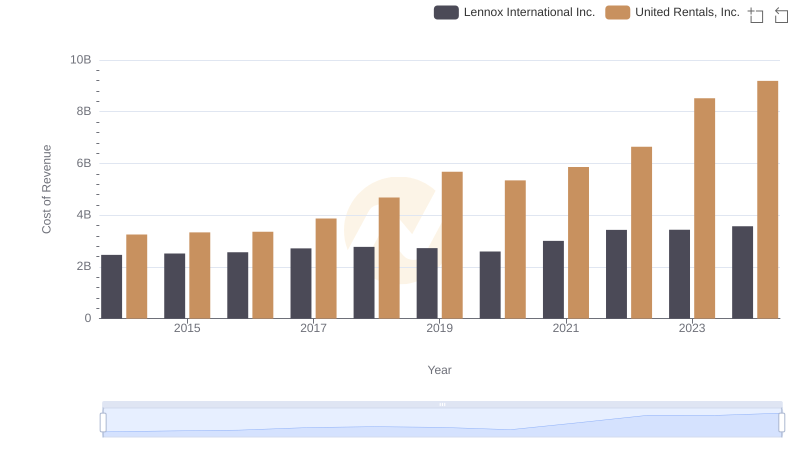
Cost of Revenue Trends: United Rentals, Inc. vs Lennox International Inc.
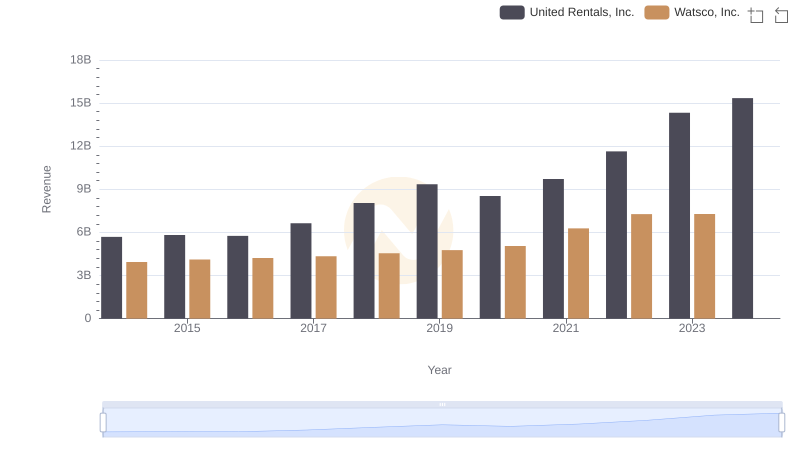
United Rentals, Inc. or Watsco, Inc.: Who Leads in Yearly Revenue?
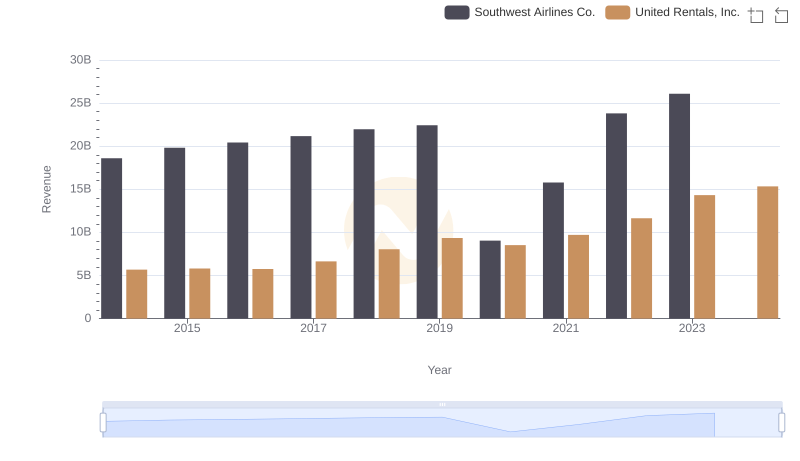
Comparing Revenue Performance: United Rentals, Inc. or Southwest Airlines Co.?
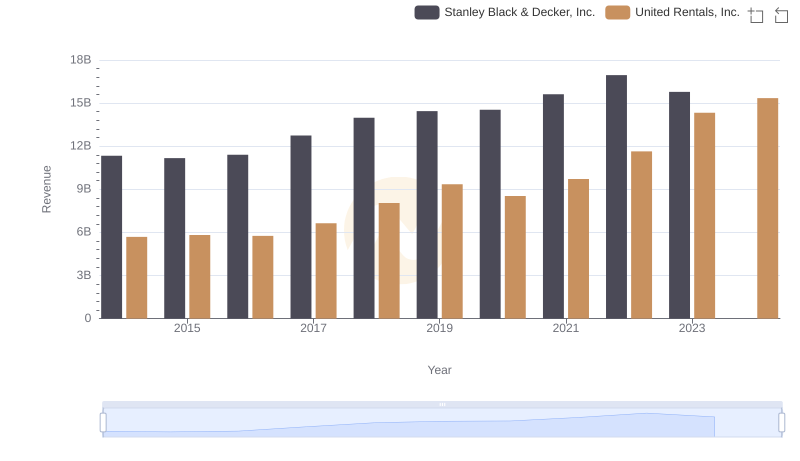
Comparing Revenue Performance: United Rentals, Inc. or Stanley Black & Decker, Inc.?
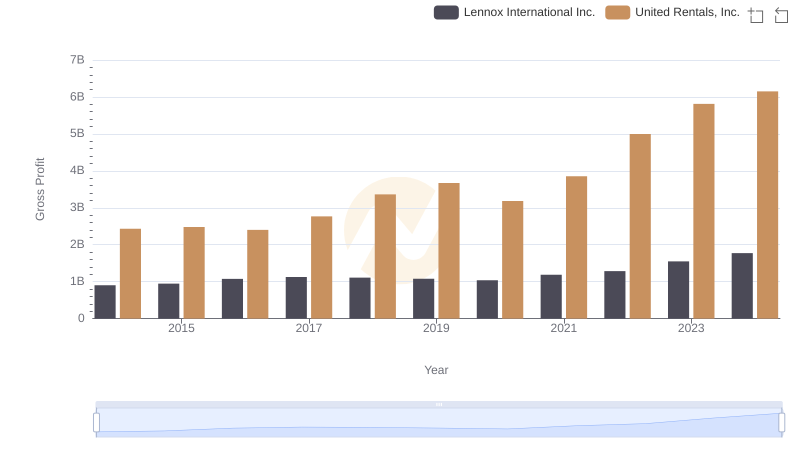
Gross Profit Comparison: United Rentals, Inc. and Lennox International Inc. Trends
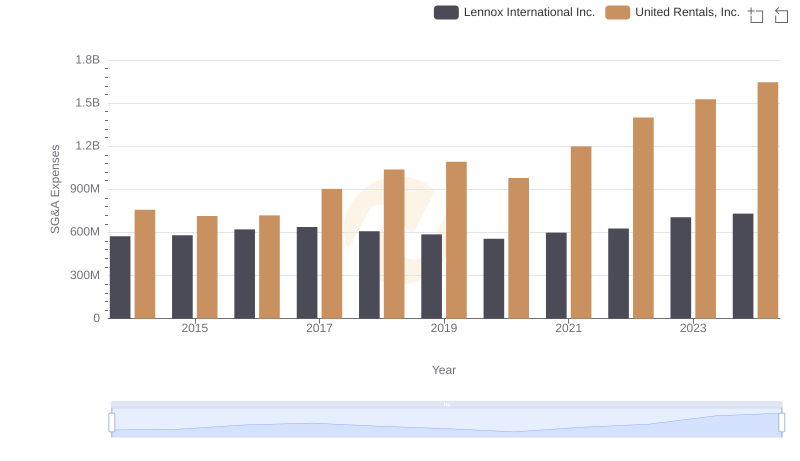
United Rentals, Inc. and Lennox International Inc.: SG&A Spending Patterns Compared
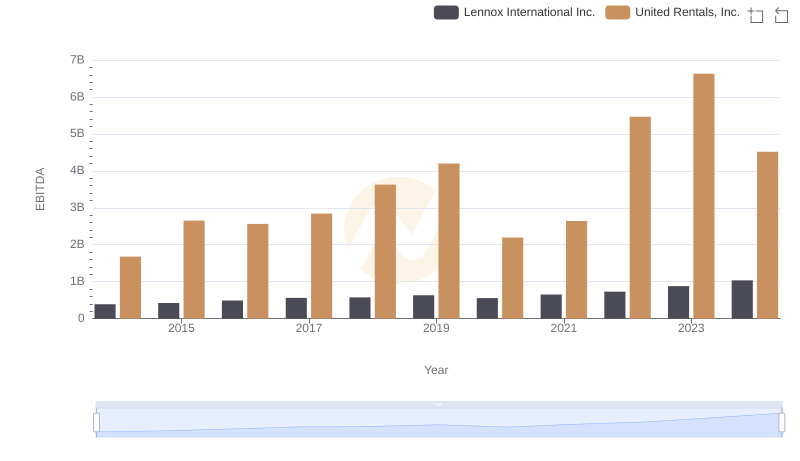
EBITDA Performance Review: United Rentals, Inc. vs Lennox International Inc.