| __timestamp | Lennox International Inc. | Rockwell Automation, Inc. |
|---|---|---|
| Wednesday, January 1, 2014 | 2464100000 | 3869600000 |
| Thursday, January 1, 2015 | 2520000000 | 3604800000 |
| Friday, January 1, 2016 | 2565100000 | 3404000000 |
| Sunday, January 1, 2017 | 2714400000 | 3687100000 |
| Monday, January 1, 2018 | 2772700000 | 3793800000 |
| Tuesday, January 1, 2019 | 2727400000 | 3794700000 |
| Wednesday, January 1, 2020 | 2594000000 | 3734600000 |
| Friday, January 1, 2021 | 3005700000 | 4099700000 |
| Saturday, January 1, 2022 | 3433700000 | 4658400000 |
| Sunday, January 1, 2023 | 3434100000 | 5341000000 |
| Monday, January 1, 2024 | 3569400000 | 5070800000 |
Unleashing the power of data
In the ever-evolving landscape of industrial automation and climate control, Rockwell Automation, Inc. and Lennox International Inc. have showcased intriguing cost of revenue trends over the past decade. From 2014 to 2024, Rockwell Automation's cost of revenue surged by approximately 38%, peaking in 2023, while Lennox International saw a 45% increase, reaching its zenith in 2024. This upward trajectory highlights the growing demand and operational scale in their respective industries.
Rockwell Automation consistently maintained a higher cost of revenue, reflecting its expansive operations in automation solutions. Meanwhile, Lennox International's steady growth underscores its strategic advancements in climate control technologies. The data reveals a pivotal shift post-2020, with both companies experiencing accelerated growth, likely driven by technological innovations and market expansion. As we look to the future, these trends offer valuable insights into the strategic directions and market dynamics shaping these industry leaders.
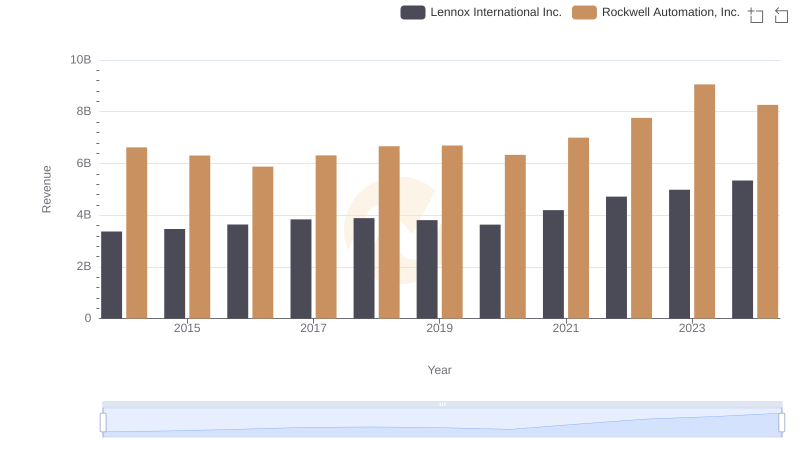
Revenue Insights: Rockwell Automation, Inc. and Lennox International Inc. Performance Compared
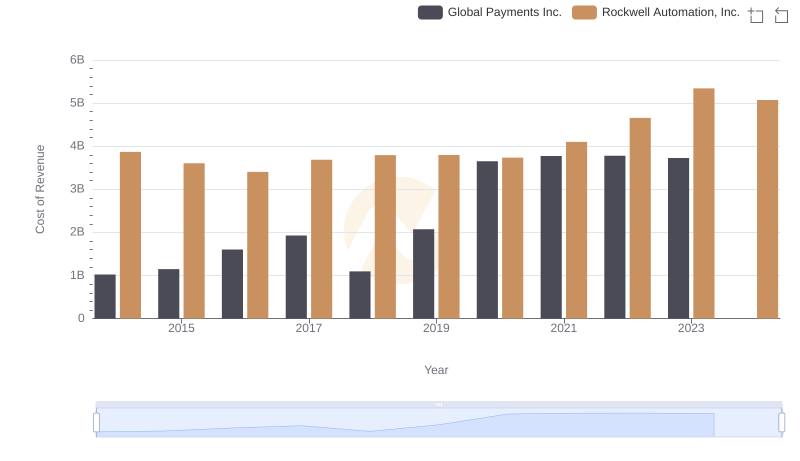
Rockwell Automation, Inc. vs Global Payments Inc.: Efficiency in Cost of Revenue Explored
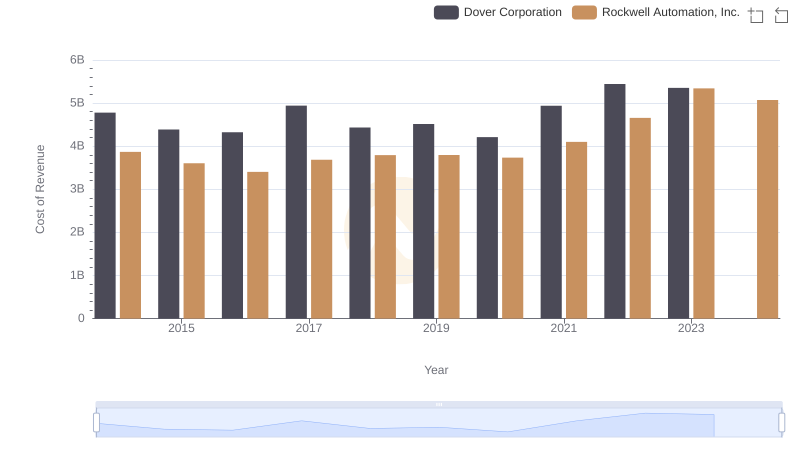
Analyzing Cost of Revenue: Rockwell Automation, Inc. and Dover Corporation
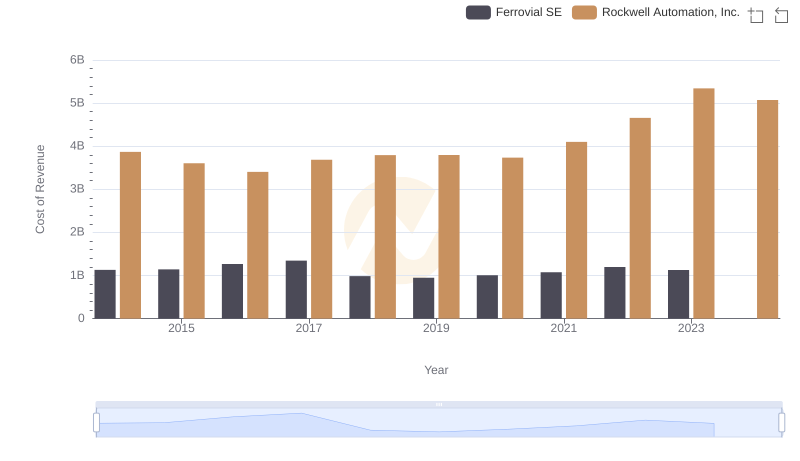
Comparing Cost of Revenue Efficiency: Rockwell Automation, Inc. vs Ferrovial SE
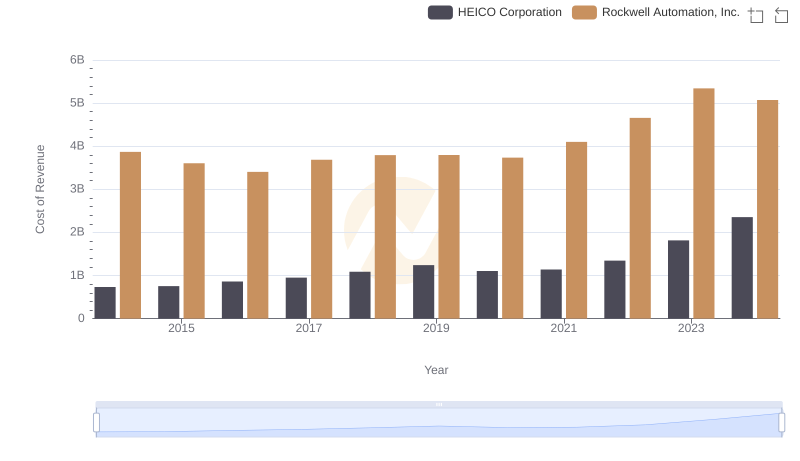
Analyzing Cost of Revenue: Rockwell Automation, Inc. and HEICO Corporation
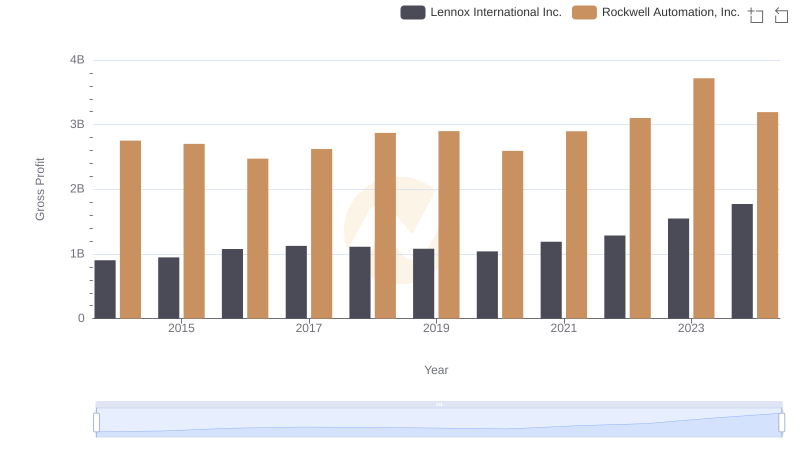
Rockwell Automation, Inc. vs Lennox International Inc.: A Gross Profit Performance Breakdown
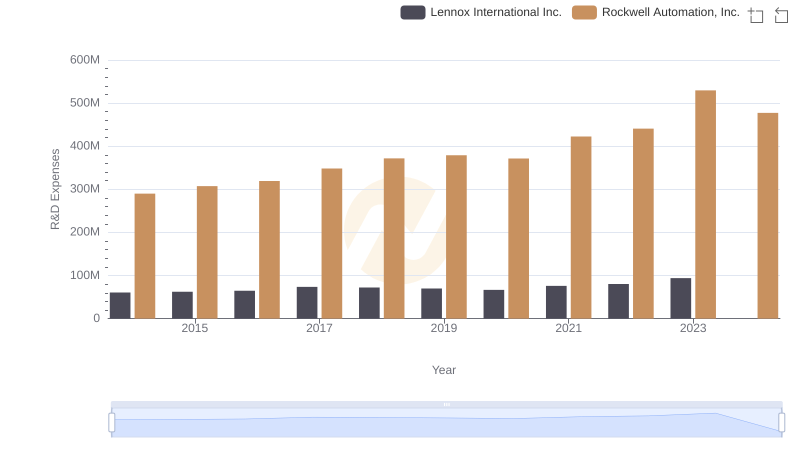
Rockwell Automation, Inc. or Lennox International Inc.: Who Invests More in Innovation?
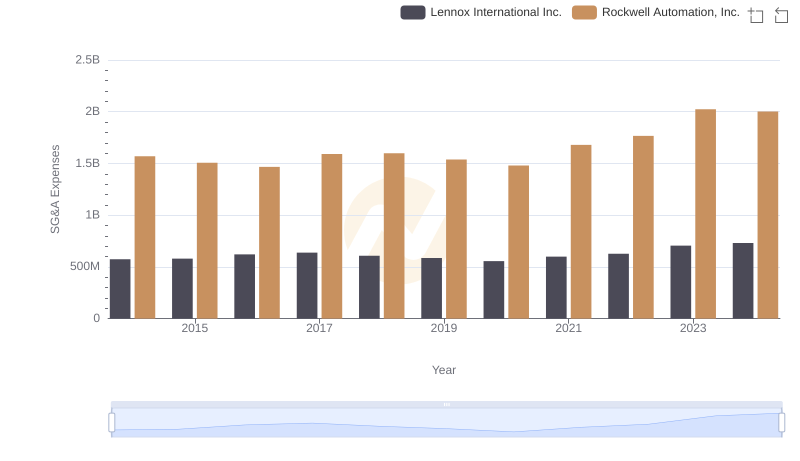
Cost Management Insights: SG&A Expenses for Rockwell Automation, Inc. and Lennox International Inc.
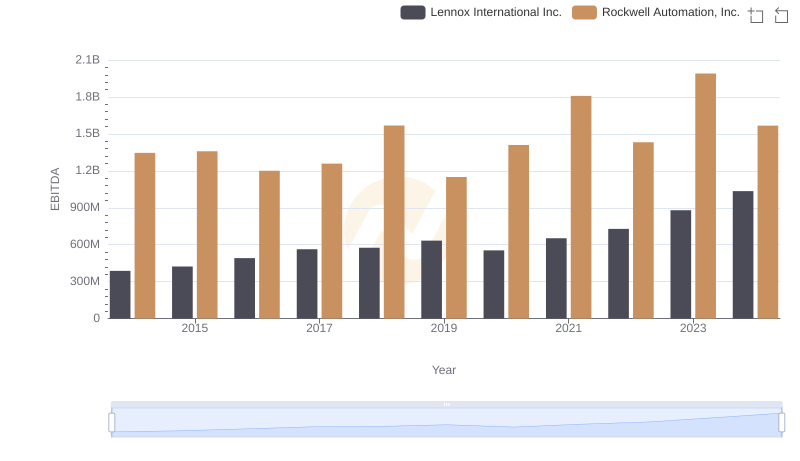
EBITDA Performance Review: Rockwell Automation, Inc. vs Lennox International Inc.