| __timestamp | International Business Machines Corporation | Teradyne, Inc. |
|---|---|---|
| Wednesday, January 1, 2014 | 24962000000 | 355804000 |
| Thursday, January 1, 2015 | 20268000000 | 390438000 |
| Friday, January 1, 2016 | 17341000000 | 68085999 |
| Sunday, January 1, 2017 | 16556000000 | 647992000 |
| Monday, January 1, 2018 | 16545000000 | 603746000 |
| Tuesday, January 1, 2019 | 14609000000 | 650398000 |
| Wednesday, January 1, 2020 | 10555000000 | 1036119000 |
| Friday, January 1, 2021 | 12409000000 | 1291304000 |
| Saturday, January 1, 2022 | 7174000000 | 954200000 |
| Sunday, January 1, 2023 | 14693000000 | 640495000 |
| Monday, January 1, 2024 | 6015000000 | 593788000 |
Igniting the spark of knowledge
In the ever-evolving landscape of technology, the financial performance of industry giants like International Business Machines Corporation (IBM) and Teradyne, Inc. offers a fascinating glimpse into their strategic maneuvers. Over the past decade, IBM's EBITDA has shown a rollercoaster pattern, peaking in 2014 and 2015 before experiencing a significant dip in 2022. This represents a decline of approximately 72% from its 2014 high. However, 2023 saw a resurgence, with EBITDA rebounding by over 110% from the previous year.
In contrast, Teradyne, Inc. has demonstrated a more stable trajectory, with a notable peak in 2021, marking a 280% increase from its 2016 low. Despite a slight dip in 2023, Teradyne's EBITDA remains robust, reflecting its resilience in the semiconductor testing market. The absence of data for 2024 suggests potential shifts in the competitive landscape, warranting close observation.
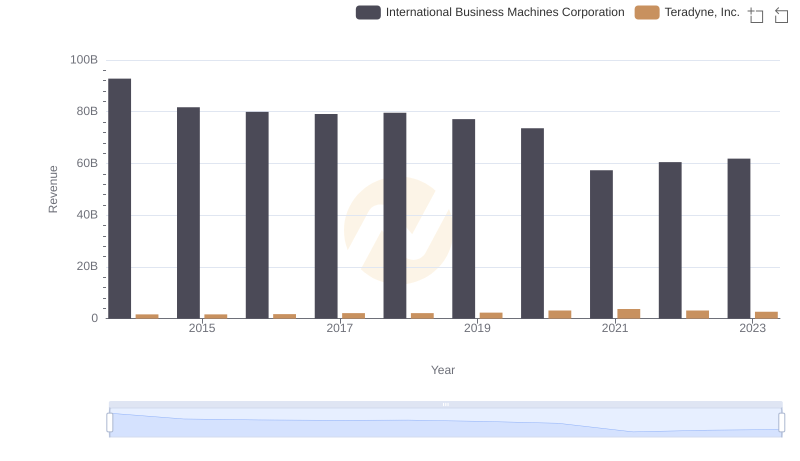
Annual Revenue Comparison: International Business Machines Corporation vs Teradyne, Inc.
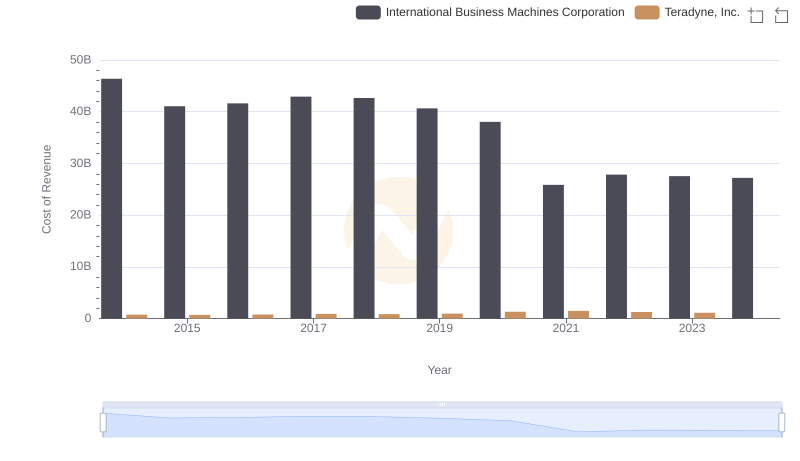
Cost of Revenue Trends: International Business Machines Corporation vs Teradyne, Inc.
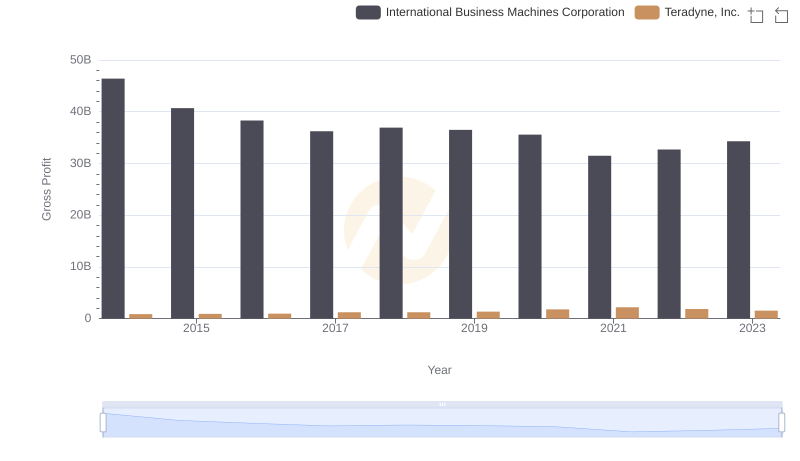
Key Insights on Gross Profit: International Business Machines Corporation vs Teradyne, Inc.
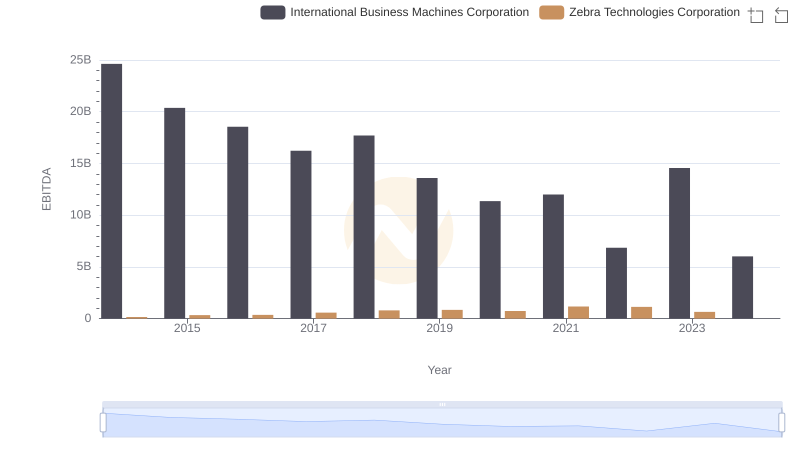
A Side-by-Side Analysis of EBITDA: International Business Machines Corporation and Zebra Technologies Corporation
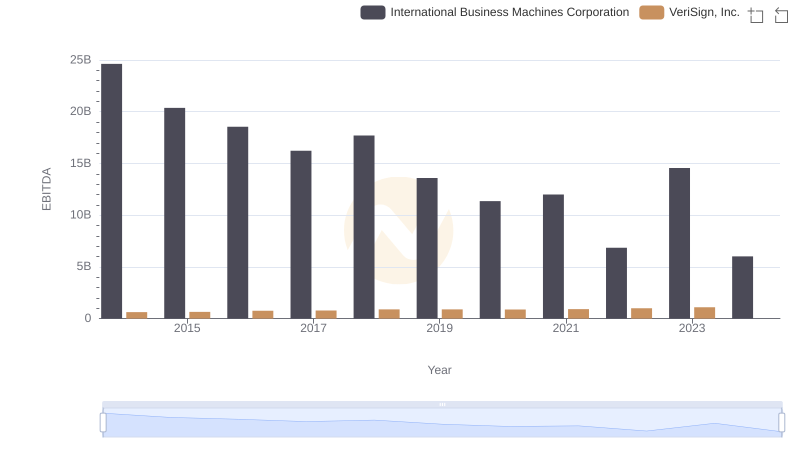
International Business Machines Corporation and VeriSign, Inc.: A Detailed Examination of EBITDA Performance
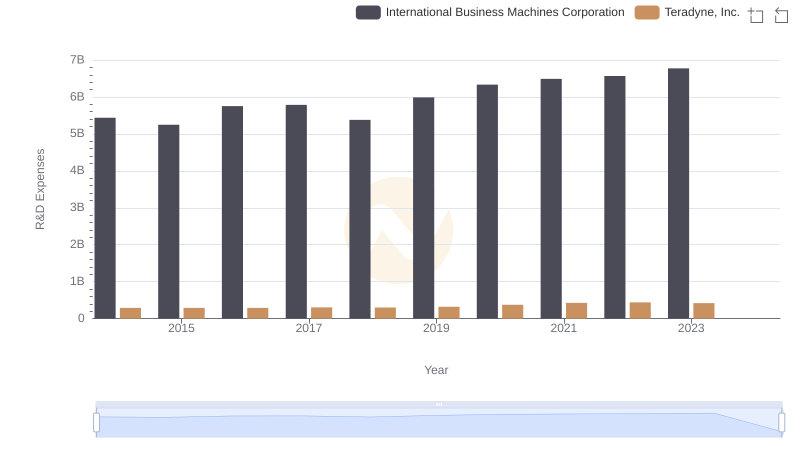
R&D Spending Showdown: International Business Machines Corporation vs Teradyne, Inc.
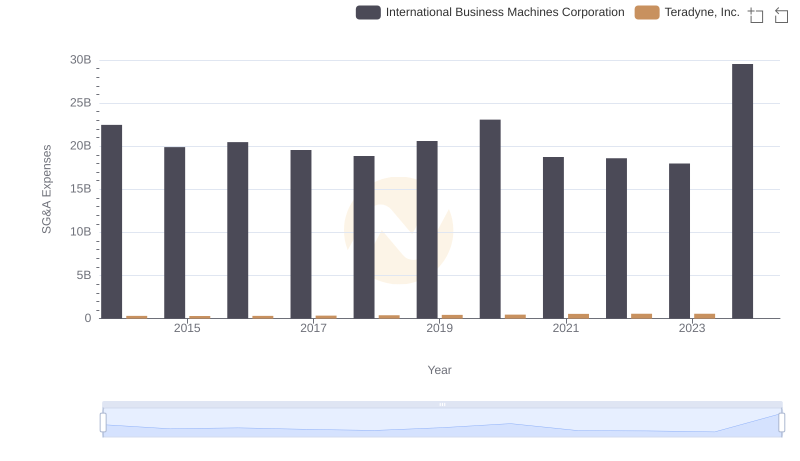
Selling, General, and Administrative Costs: International Business Machines Corporation vs Teradyne, Inc.
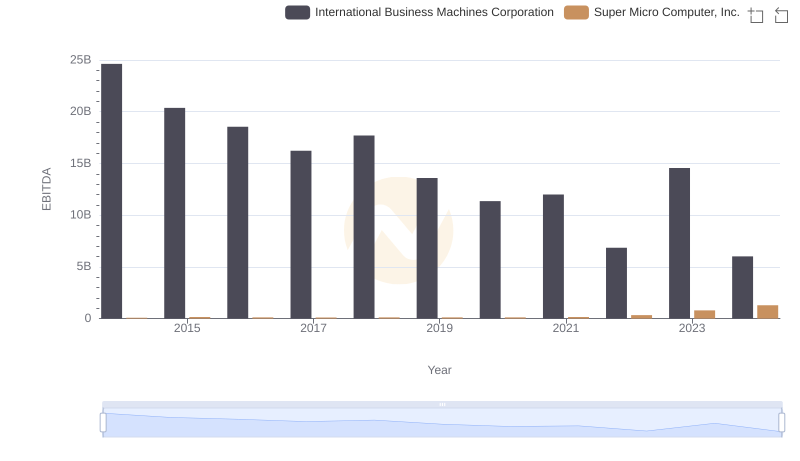
A Side-by-Side Analysis of EBITDA: International Business Machines Corporation and Super Micro Computer, Inc.
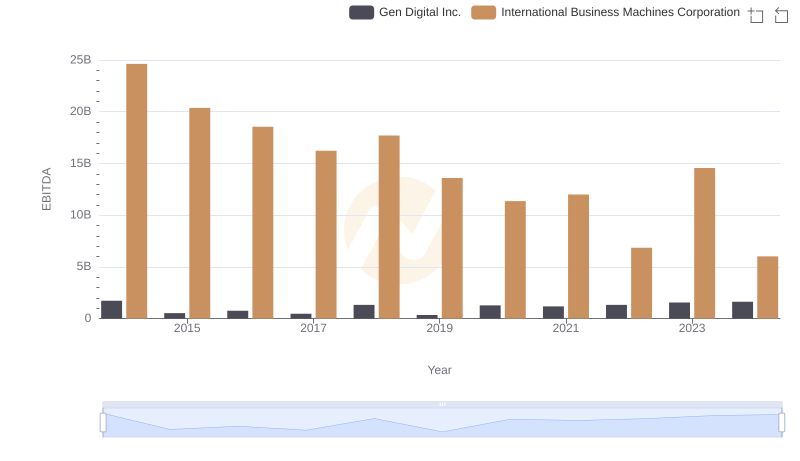
Comprehensive EBITDA Comparison: International Business Machines Corporation vs Gen Digital Inc.
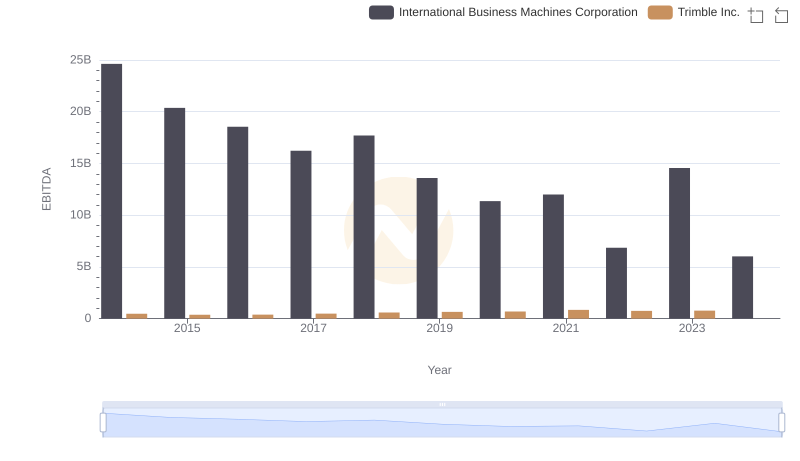
Comparative EBITDA Analysis: International Business Machines Corporation vs Trimble Inc.
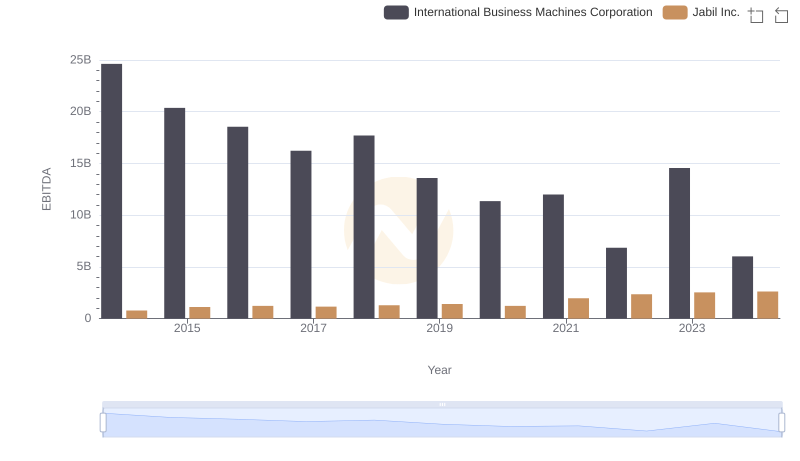
International Business Machines Corporation and Jabil Inc.: A Detailed Examination of EBITDA Performance
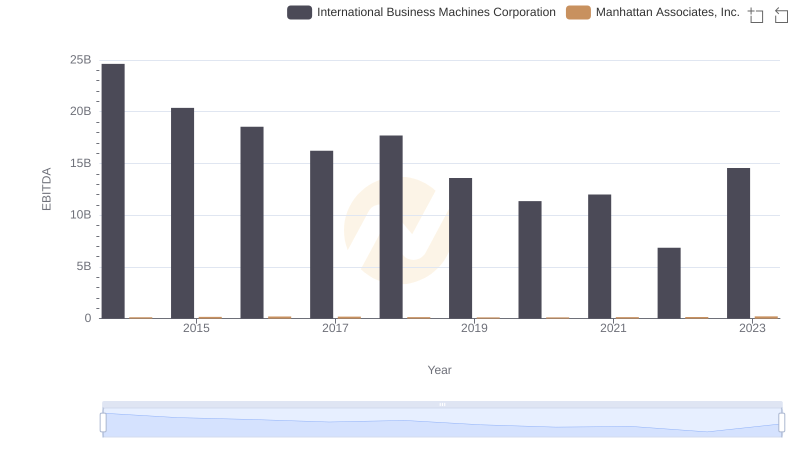
EBITDA Performance Review: International Business Machines Corporation vs Manhattan Associates, Inc.