| __timestamp | International Business Machines Corporation | Teradyne, Inc. |
|---|---|---|
| Wednesday, January 1, 2014 | 92793000000 | 1647824000 |
| Thursday, January 1, 2015 | 81742000000 | 1639578000 |
| Friday, January 1, 2016 | 79920000000 | 1753250000 |
| Sunday, January 1, 2017 | 79139000000 | 2136606000 |
| Monday, January 1, 2018 | 79591000000 | 2100802000 |
| Tuesday, January 1, 2019 | 57714000000 | 2294965000 |
| Wednesday, January 1, 2020 | 55179000000 | 3121469000 |
| Friday, January 1, 2021 | 57351000000 | 3702881000 |
| Saturday, January 1, 2022 | 60530000000 | 3155045000 |
| Sunday, January 1, 2023 | 61860000000 | 2676298000 |
| Monday, January 1, 2024 | 62753000000 | 2819880000 |
Cracking the code
In the ever-evolving landscape of technology, the financial trajectories of industry giants like International Business Machines Corporation (IBM) and Teradyne, Inc. offer a fascinating glimpse into market dynamics. Over the past decade, IBM's annual revenue has seen a notable decline, dropping from its peak in 2014 to a 32% decrease by 2023. This trend reflects the company's strategic shifts and market challenges.
Conversely, Teradyne, Inc., a leader in semiconductor testing, has experienced a more modest yet steady growth. From 2014 to 2022, Teradyne's revenue increased by approximately 91%, showcasing its resilience and adaptability in a competitive sector. However, data for 2024 remains unavailable, leaving room for speculation on future trends.
This comparison underscores the diverse strategies and market responses of these two tech titans, offering valuable insights for investors and industry enthusiasts alike.
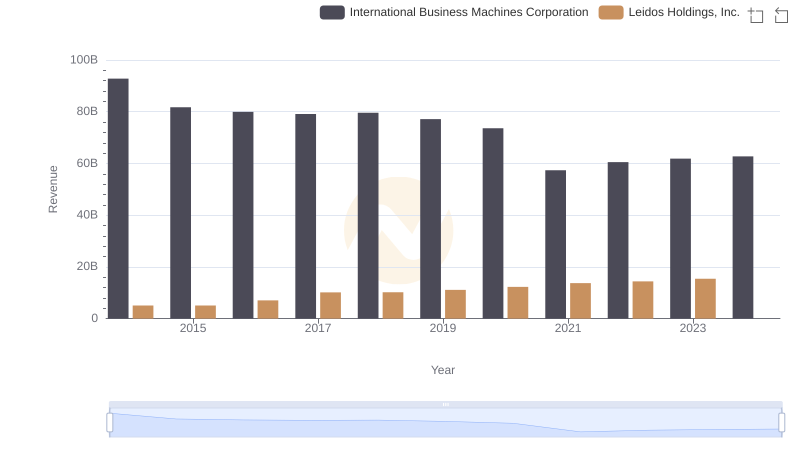
Comparing Revenue Performance: International Business Machines Corporation or Leidos Holdings, Inc.?
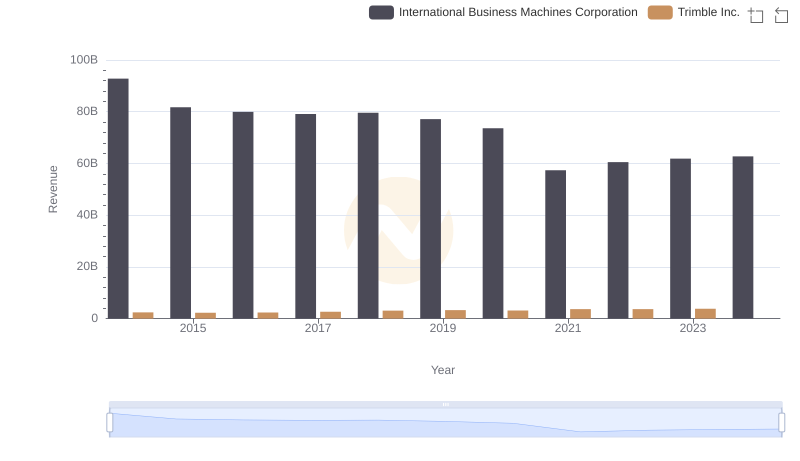
International Business Machines Corporation or Trimble Inc.: Who Leads in Yearly Revenue?
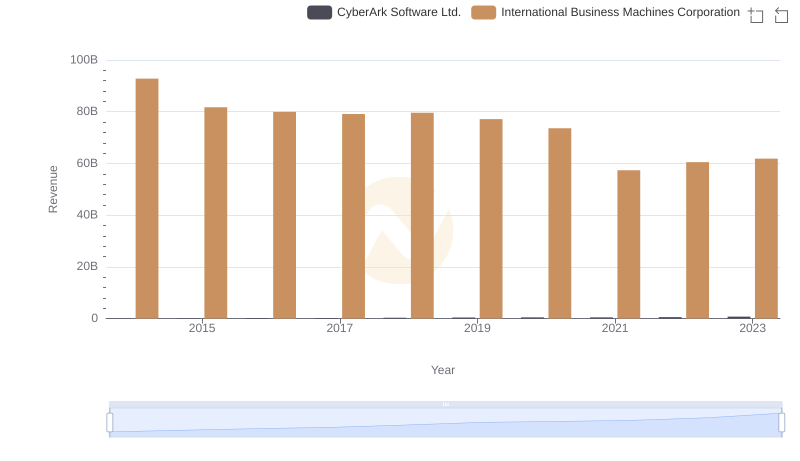
International Business Machines Corporation or CyberArk Software Ltd.: Who Leads in Yearly Revenue?
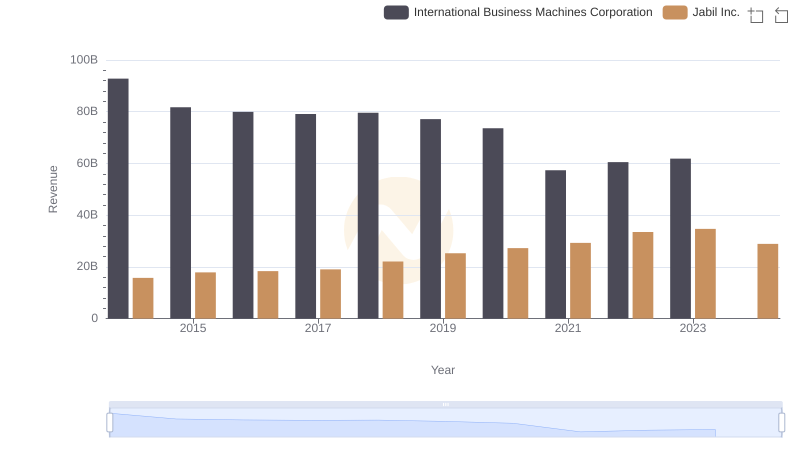
International Business Machines Corporation vs Jabil Inc.: Examining Key Revenue Metrics
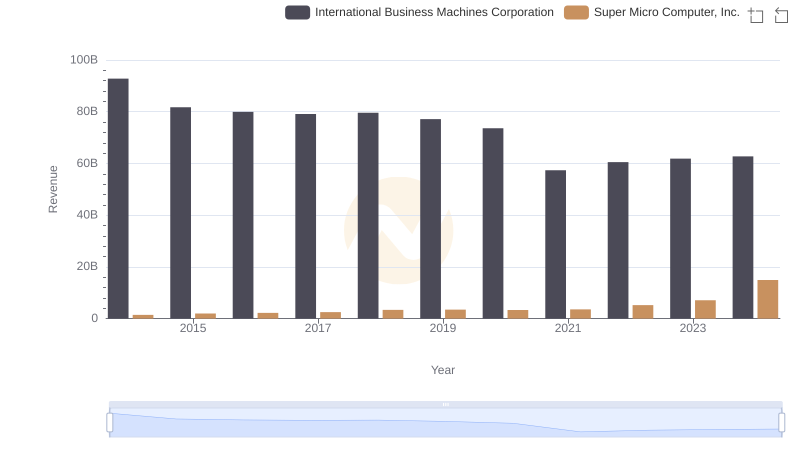
International Business Machines Corporation or Super Micro Computer, Inc.: Who Leads in Yearly Revenue?
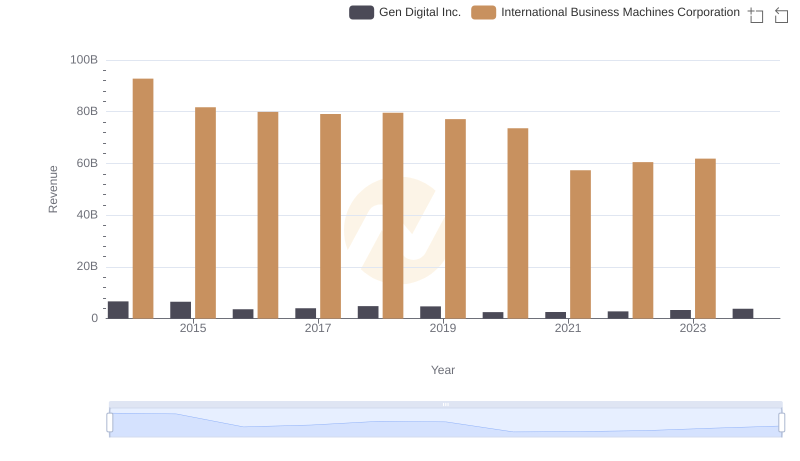
Revenue Insights: International Business Machines Corporation and Gen Digital Inc. Performance Compared
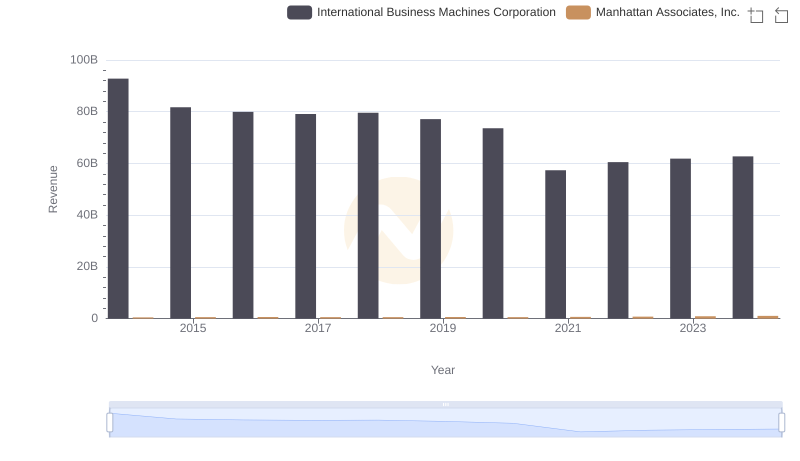
International Business Machines Corporation vs Manhattan Associates, Inc.: Annual Revenue Growth Compared
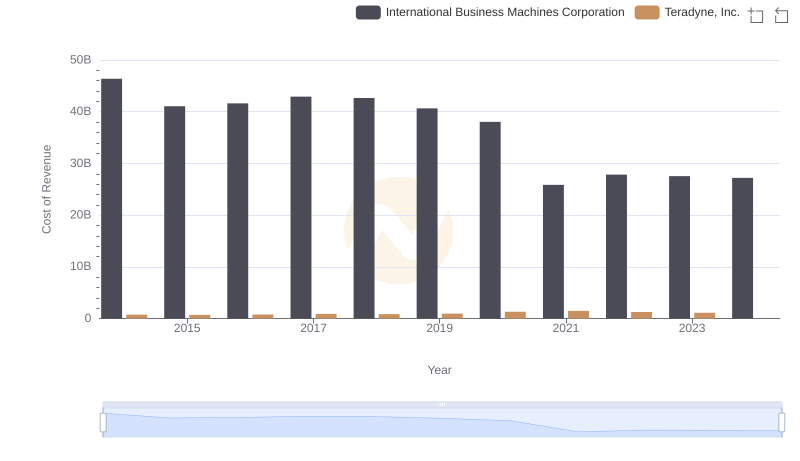
Cost of Revenue Trends: International Business Machines Corporation vs Teradyne, Inc.
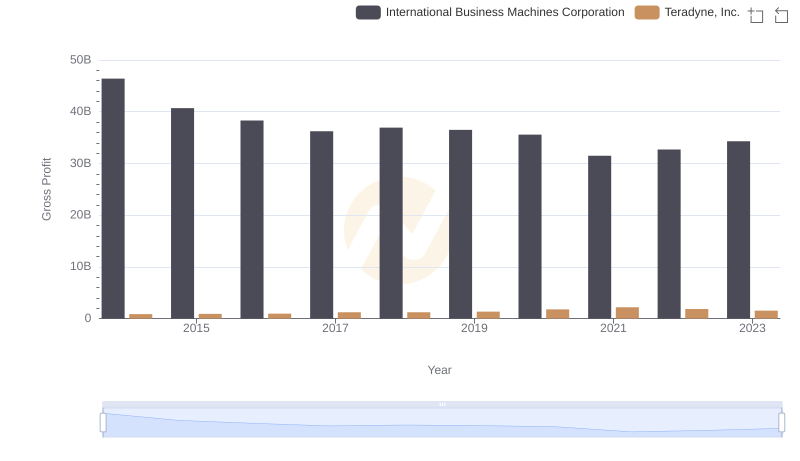
Key Insights on Gross Profit: International Business Machines Corporation vs Teradyne, Inc.
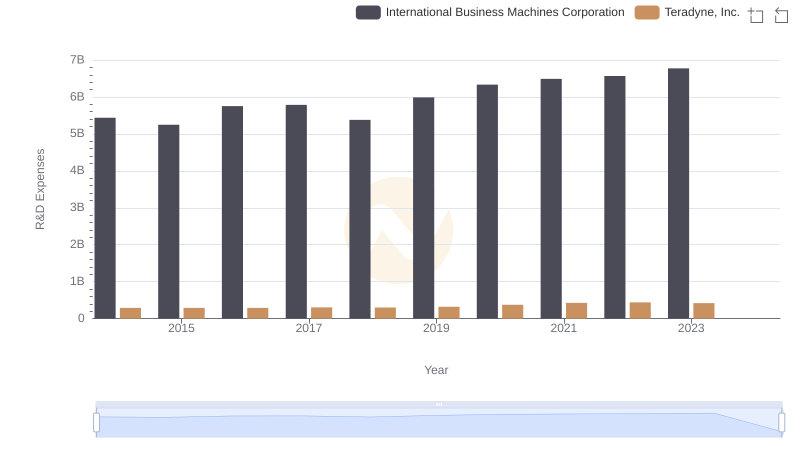
R&D Spending Showdown: International Business Machines Corporation vs Teradyne, Inc.
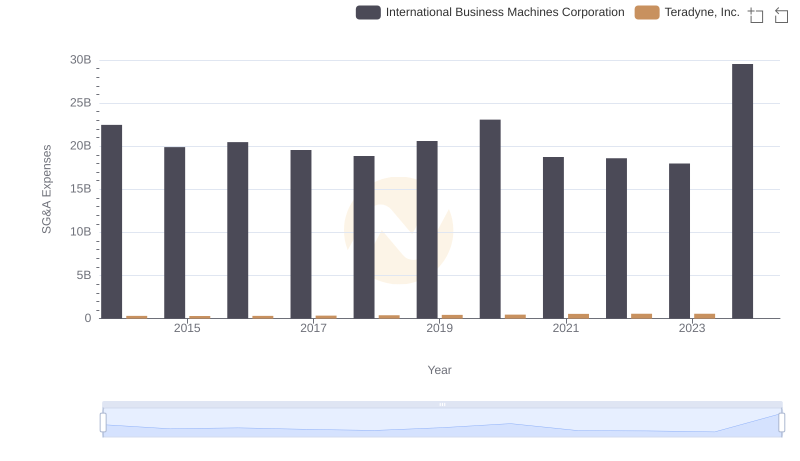
Selling, General, and Administrative Costs: International Business Machines Corporation vs Teradyne, Inc.
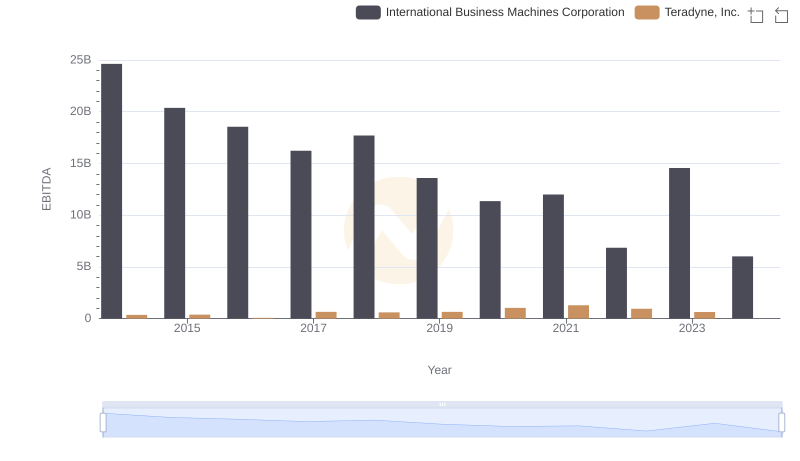
EBITDA Performance Review: International Business Machines Corporation vs Teradyne, Inc.