| __timestamp | International Business Machines Corporation | Zebra Technologies Corporation |
|---|---|---|
| Wednesday, January 1, 2014 | 24962000000 | 154836000 |
| Thursday, January 1, 2015 | 20268000000 | 336000000 |
| Friday, January 1, 2016 | 17341000000 | 366000000 |
| Sunday, January 1, 2017 | 16556000000 | 580000000 |
| Monday, January 1, 2018 | 16545000000 | 798000000 |
| Tuesday, January 1, 2019 | 14609000000 | 843000000 |
| Wednesday, January 1, 2020 | 10555000000 | 736000000 |
| Friday, January 1, 2021 | 12409000000 | 1173000000 |
| Saturday, January 1, 2022 | 7174000000 | 1140000000 |
| Sunday, January 1, 2023 | 14693000000 | 652000000 |
| Monday, January 1, 2024 | 6015000000 | 937000000 |
Igniting the spark of knowledge
In the ever-evolving landscape of technology, understanding financial health is crucial. This analysis delves into the EBITDA performance of two industry giants: International Business Machines Corporation (IBM) and Zebra Technologies Corporation, from 2014 to 2023.
IBM, a stalwart in the tech industry, showcased a fluctuating EBITDA, peaking in 2014 with a robust 24.6 billion, but experiencing a significant dip to 6 billion by 2024. This represents a dramatic decrease of approximately 75%, highlighting the challenges faced by legacy tech companies in adapting to modern demands.
Conversely, Zebra Technologies, a leader in enterprise asset intelligence, demonstrated a steady growth trajectory. From a modest 155 million in 2014, Zebra's EBITDA surged to 1.17 billion in 2021, marking an impressive increase of over 650%. However, data for 2024 is missing, leaving room for speculation on its future performance.
This side-by-side analysis underscores the dynamic nature of the tech industry, where adaptability and innovation are key to sustained financial success.
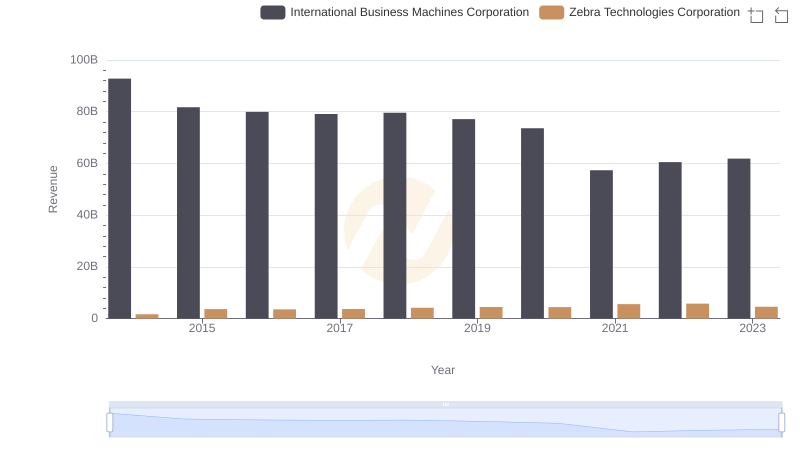
International Business Machines Corporation vs Zebra Technologies Corporation: Examining Key Revenue Metrics
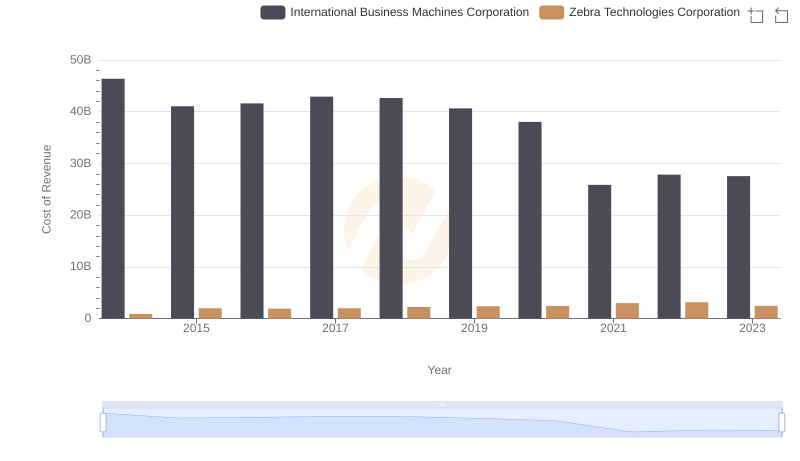
Cost of Revenue Trends: International Business Machines Corporation vs Zebra Technologies Corporation
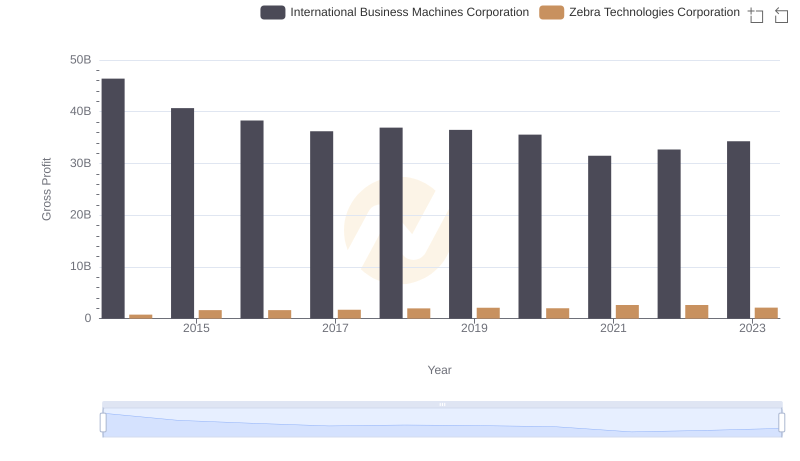
Gross Profit Trends Compared: International Business Machines Corporation vs Zebra Technologies Corporation
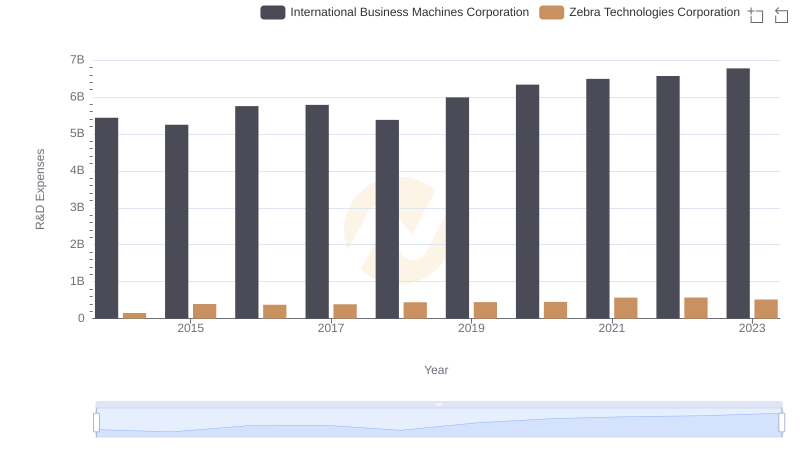
Analyzing R&D Budgets: International Business Machines Corporation vs Zebra Technologies Corporation

International Business Machines Corporation vs FLEETCOR Technologies, Inc.: In-Depth EBITDA Performance Comparison
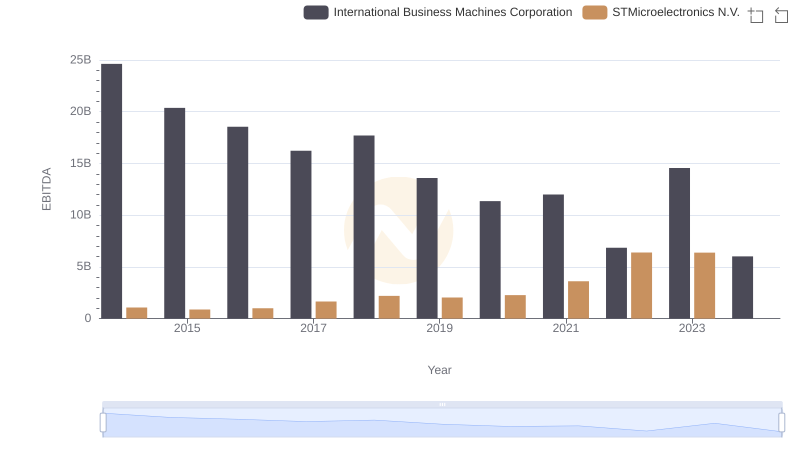
Professional EBITDA Benchmarking: International Business Machines Corporation vs STMicroelectronics N.V.
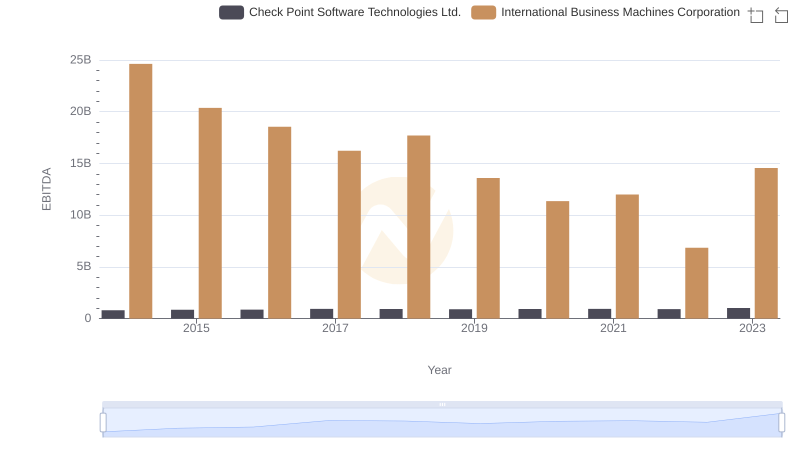
International Business Machines Corporation and Check Point Software Technologies Ltd.: A Detailed Examination of EBITDA Performance
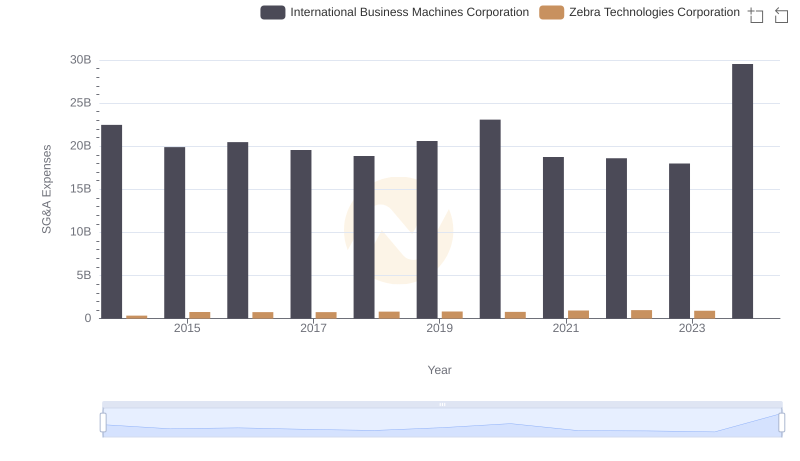
Who Optimizes SG&A Costs Better? International Business Machines Corporation or Zebra Technologies Corporation
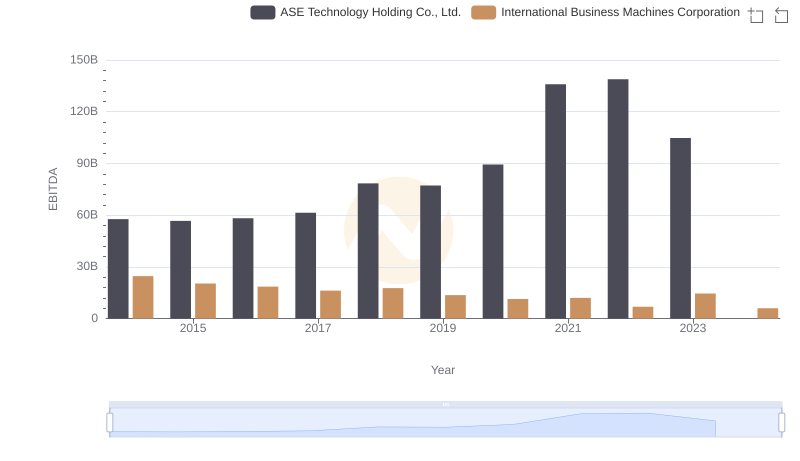
EBITDA Performance Review: International Business Machines Corporation vs ASE Technology Holding Co., Ltd.
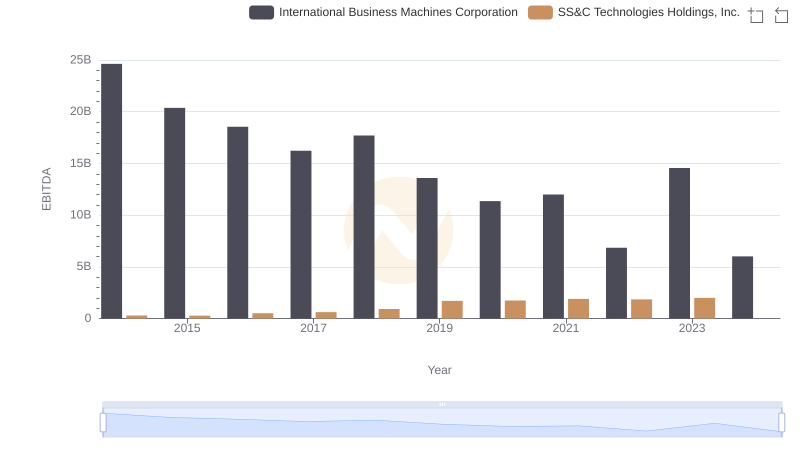
Comprehensive EBITDA Comparison: International Business Machines Corporation vs SS&C Technologies Holdings, Inc.
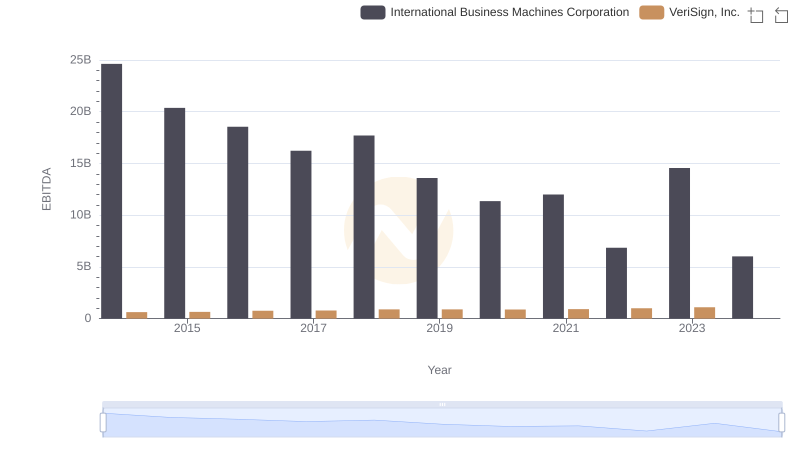
International Business Machines Corporation and VeriSign, Inc.: A Detailed Examination of EBITDA Performance
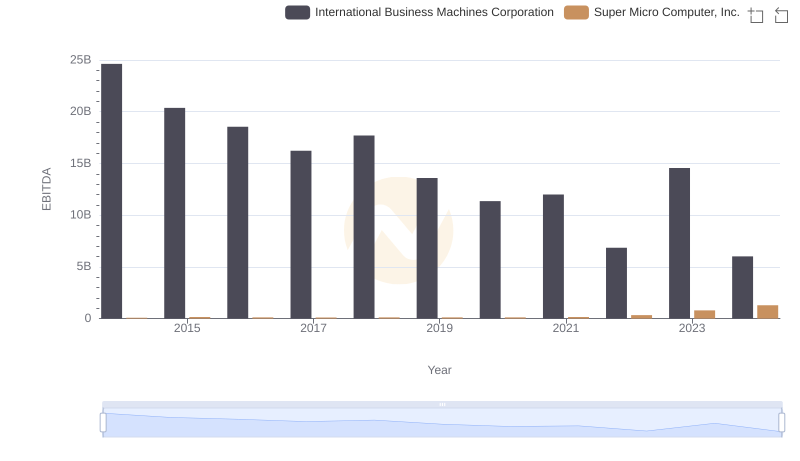
A Side-by-Side Analysis of EBITDA: International Business Machines Corporation and Super Micro Computer, Inc.