| __timestamp | International Business Machines Corporation | VeriSign, Inc. |
|---|---|---|
| Wednesday, January 1, 2014 | 24962000000 | 632995000 |
| Thursday, January 1, 2015 | 20268000000 | 656772000 |
| Friday, January 1, 2016 | 17341000000 | 754904000 |
| Sunday, January 1, 2017 | 16556000000 | 785226000 |
| Monday, January 1, 2018 | 16545000000 | 892728000 |
| Tuesday, January 1, 2019 | 14609000000 | 895717000 |
| Wednesday, January 1, 2020 | 10555000000 | 886740000 |
| Friday, January 1, 2021 | 12409000000 | 913414000 |
| Saturday, January 1, 2022 | 7174000000 | 1002400000 |
| Sunday, January 1, 2023 | 14693000000 | 1095900000 |
| Monday, January 1, 2024 | 6015000000 | 1134100000 |
Data in motion
In the ever-evolving landscape of technology, understanding financial performance is crucial. This analysis delves into the EBITDA trends of two industry giants, International Business Machines Corporation (IBM) and VeriSign, Inc., from 2014 to 2023. Over this decade, IBM's EBITDA experienced a significant decline of approximately 75%, from a peak in 2014 to a low in 2024. This trend reflects the challenges faced by traditional tech companies in adapting to new market dynamics. In contrast, VeriSign's EBITDA showed a steady growth of around 73%, highlighting its resilience and strategic positioning in the digital security domain. Notably, 2023 marked a resurgence for IBM, with a 113% increase from the previous year, signaling potential recovery. However, data for 2024 is incomplete, leaving room for speculation. This comparative study underscores the importance of strategic agility in maintaining financial health in the tech sector.
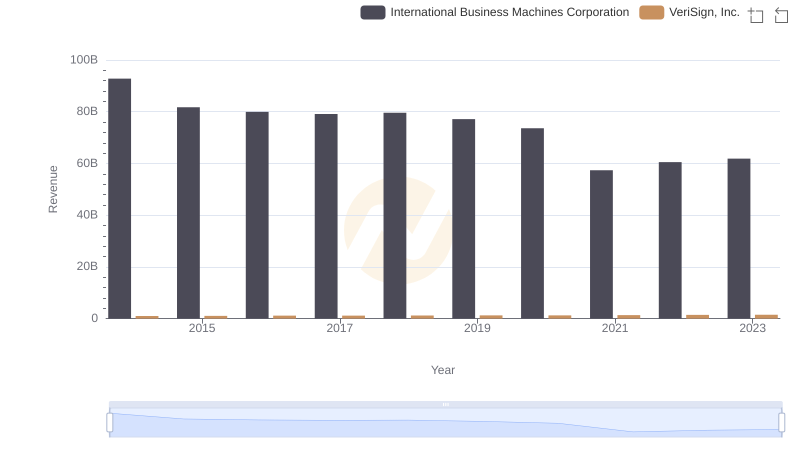
Who Generates More Revenue? International Business Machines Corporation or VeriSign, Inc.
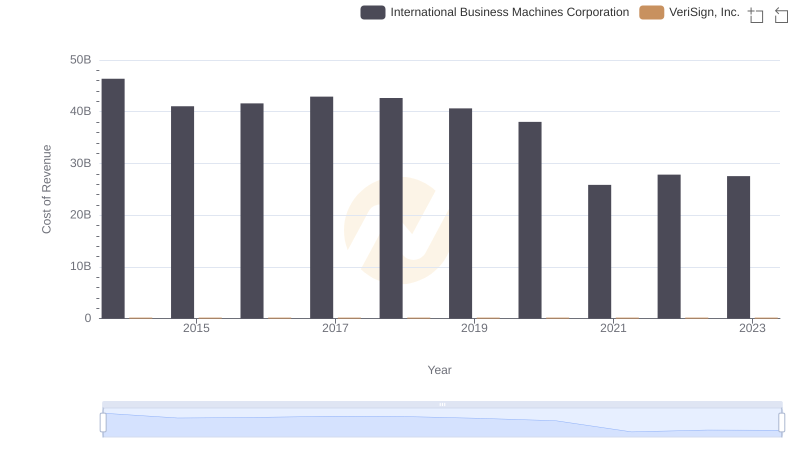
Cost of Revenue: Key Insights for International Business Machines Corporation and VeriSign, Inc.
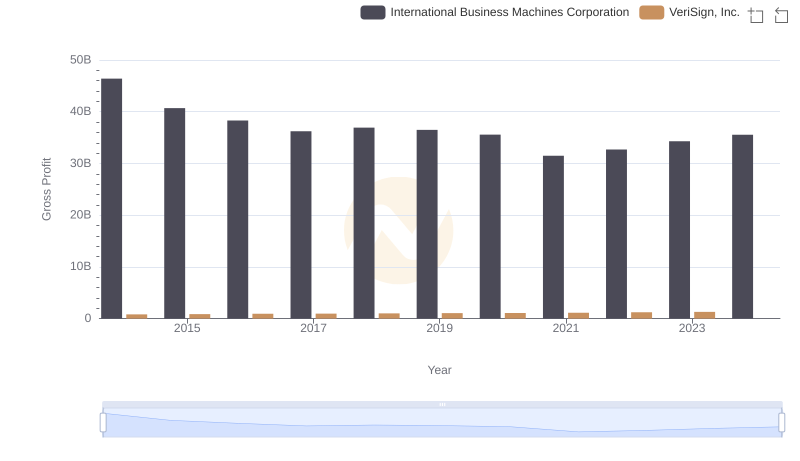
Gross Profit Analysis: Comparing International Business Machines Corporation and VeriSign, Inc.
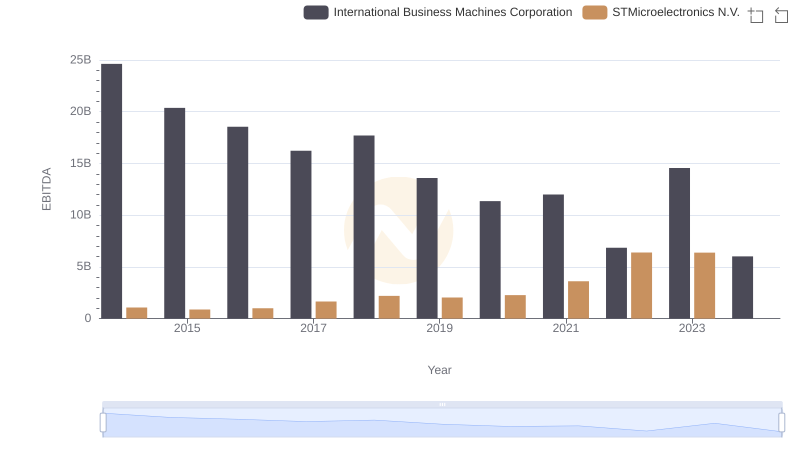
Professional EBITDA Benchmarking: International Business Machines Corporation vs STMicroelectronics N.V.
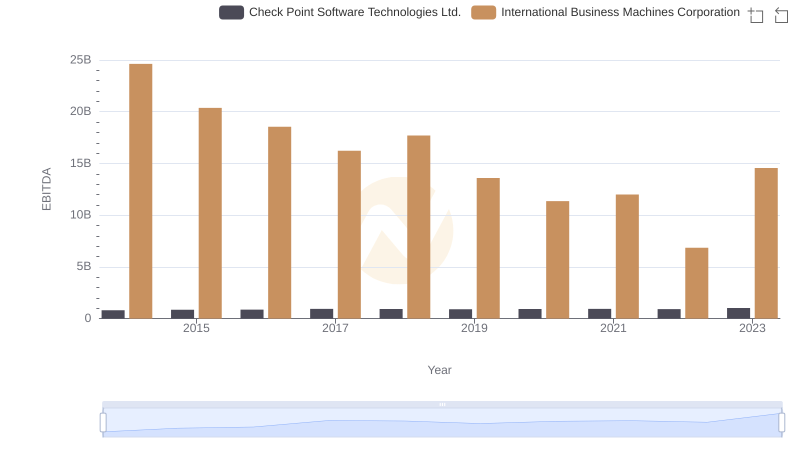
International Business Machines Corporation and Check Point Software Technologies Ltd.: A Detailed Examination of EBITDA Performance
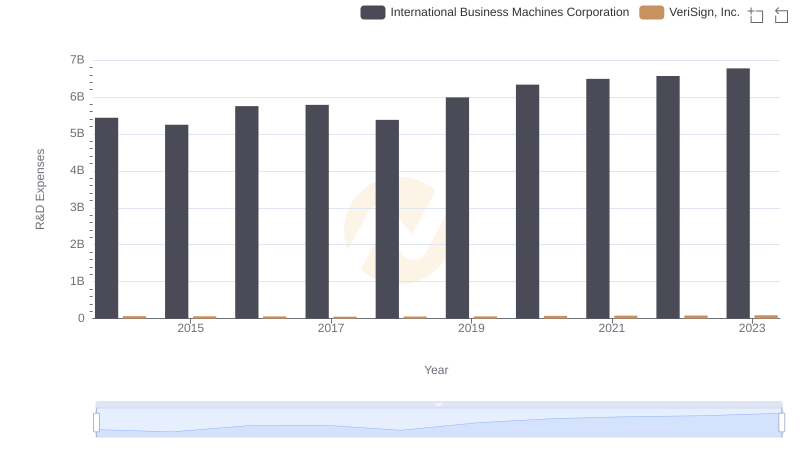
International Business Machines Corporation vs VeriSign, Inc.: Strategic Focus on R&D Spending
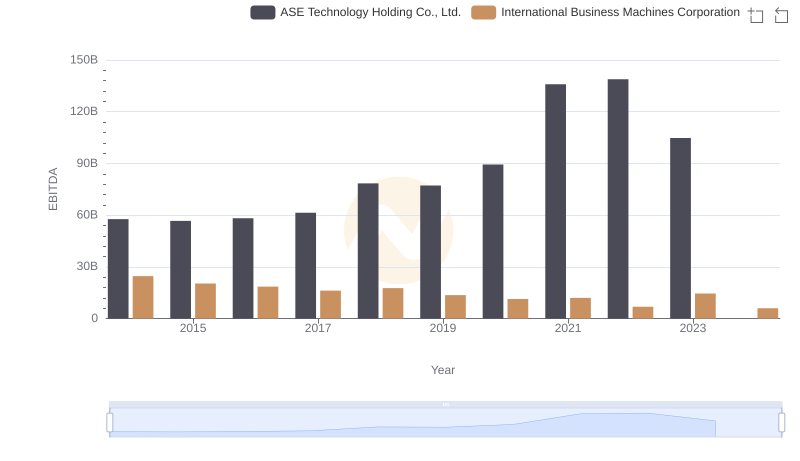
EBITDA Performance Review: International Business Machines Corporation vs ASE Technology Holding Co., Ltd.
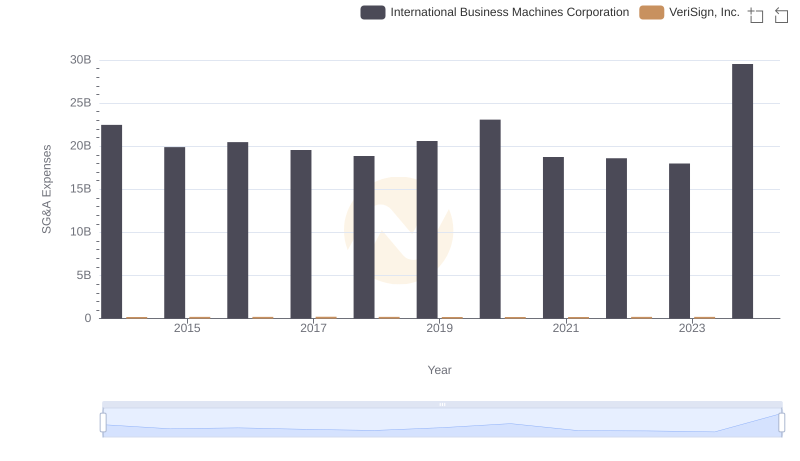
SG&A Efficiency Analysis: Comparing International Business Machines Corporation and VeriSign, Inc.
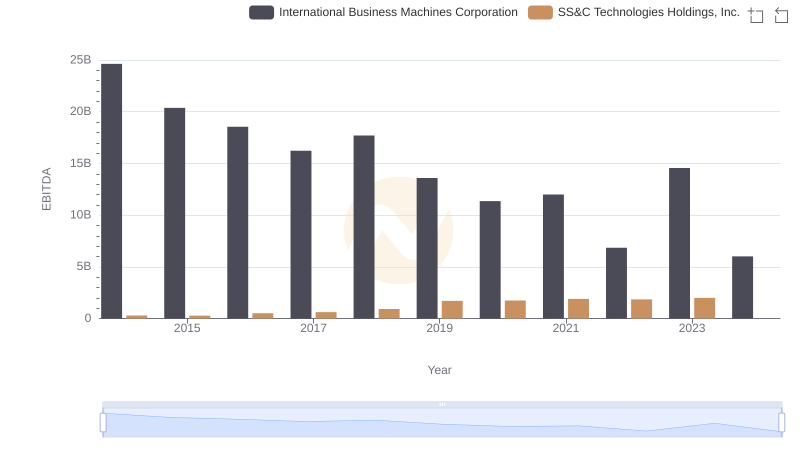
Comprehensive EBITDA Comparison: International Business Machines Corporation vs SS&C Technologies Holdings, Inc.
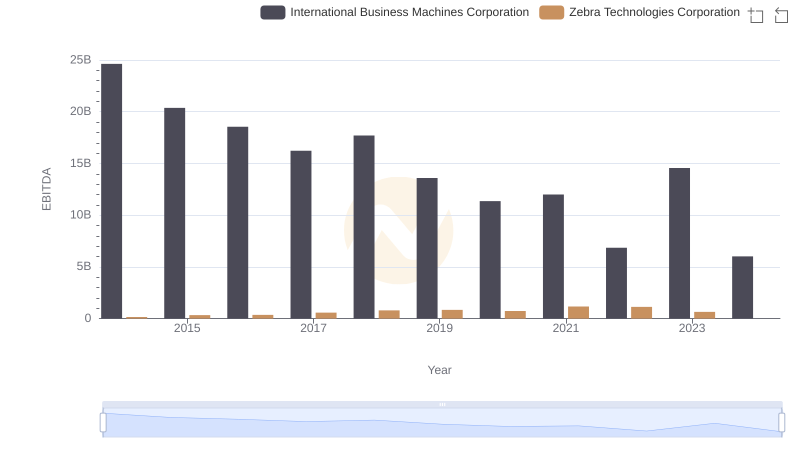
A Side-by-Side Analysis of EBITDA: International Business Machines Corporation and Zebra Technologies Corporation
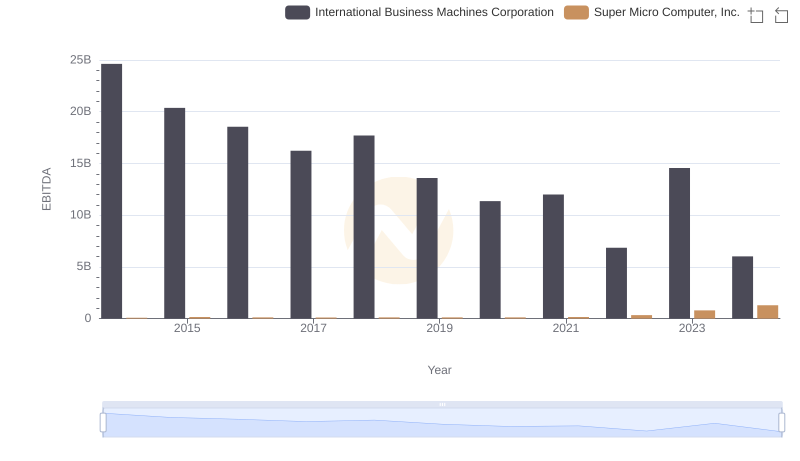
A Side-by-Side Analysis of EBITDA: International Business Machines Corporation and Super Micro Computer, Inc.
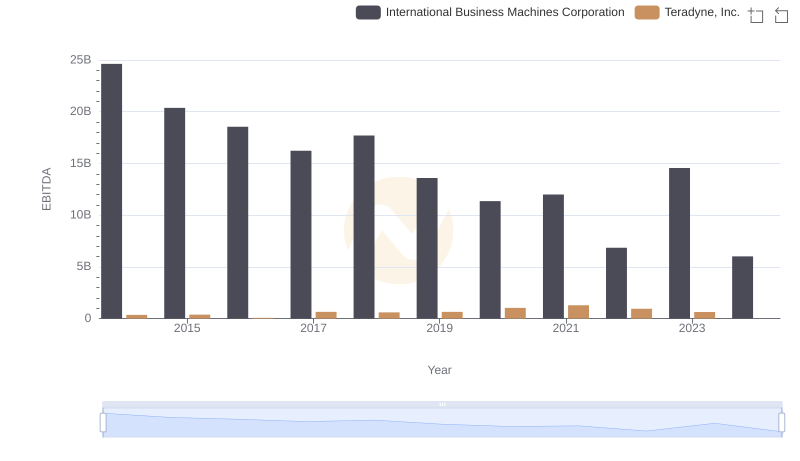
EBITDA Performance Review: International Business Machines Corporation vs Teradyne, Inc.