| __timestamp | International Business Machines Corporation | Manhattan Associates, Inc. |
|---|---|---|
| Wednesday, January 1, 2014 | 24962000000 | 133501000 |
| Thursday, January 1, 2015 | 20268000000 | 169210000 |
| Friday, January 1, 2016 | 17341000000 | 203397000 |
| Sunday, January 1, 2017 | 16556000000 | 197626000 |
| Monday, January 1, 2018 | 16545000000 | 142500000 |
| Tuesday, January 1, 2019 | 14609000000 | 123911000 |
| Wednesday, January 1, 2020 | 10555000000 | 123007000 |
| Friday, January 1, 2021 | 12409000000 | 142247000 |
| Saturday, January 1, 2022 | 7174000000 | 159363000 |
| Sunday, January 1, 2023 | 14693000000 | 215633000 |
| Monday, January 1, 2024 | 6015000000 | 267897000 |
Data in motion
In the ever-evolving landscape of technology, the financial performance of industry giants like International Business Machines Corporation (IBM) and Manhattan Associates, Inc. offers a fascinating glimpse into their strategic maneuvers. Over the past decade, IBM's EBITDA has seen a significant decline, dropping from a peak of approximately $24.6 billion in 2014 to around $6 billion in 2024. This represents a staggering 76% decrease, reflecting the challenges faced by the company in adapting to new market dynamics.
Conversely, Manhattan Associates, a leader in supply chain and omnichannel commerce, has demonstrated resilience and growth. From 2014 to 2024, their EBITDA has more than doubled, rising from $133 million to $273 million. This growth underscores their successful adaptation to the digital transformation era.
These contrasting trajectories highlight the importance of innovation and strategic agility in maintaining financial health in the tech industry.
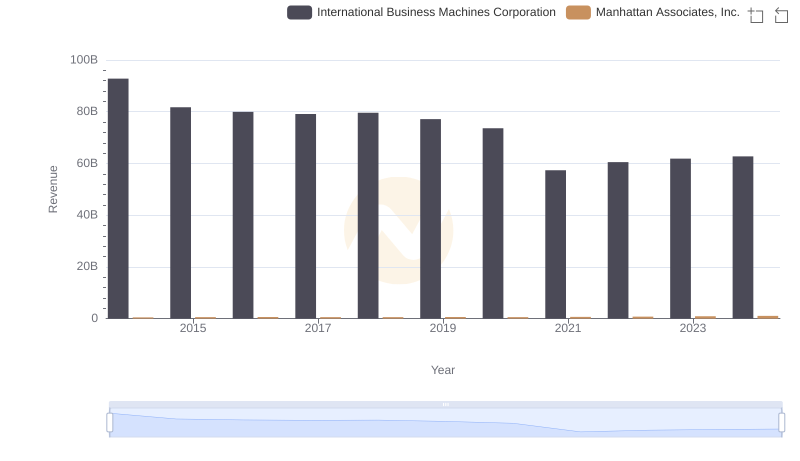
International Business Machines Corporation vs Manhattan Associates, Inc.: Annual Revenue Growth Compared
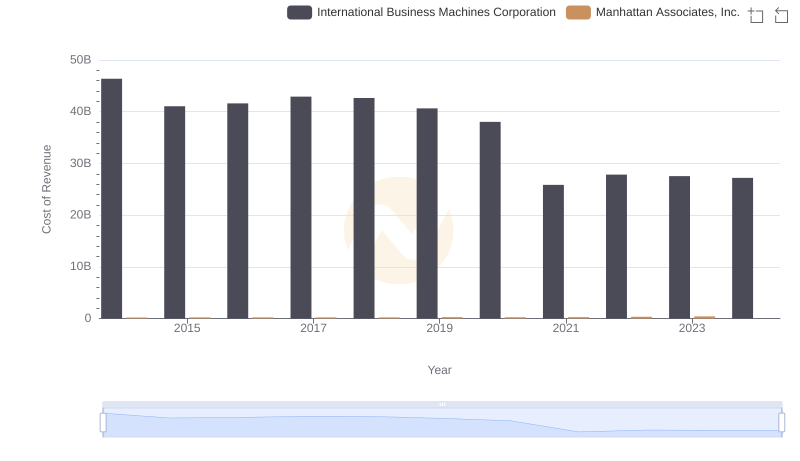
Comparing Cost of Revenue Efficiency: International Business Machines Corporation vs Manhattan Associates, Inc.
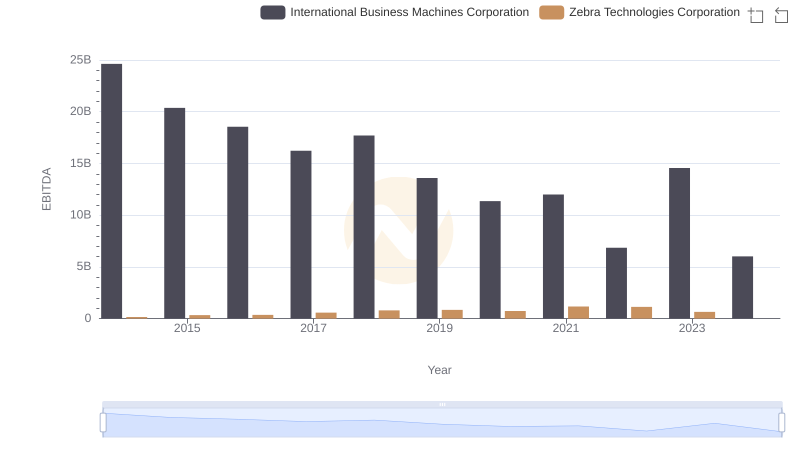
A Side-by-Side Analysis of EBITDA: International Business Machines Corporation and Zebra Technologies Corporation
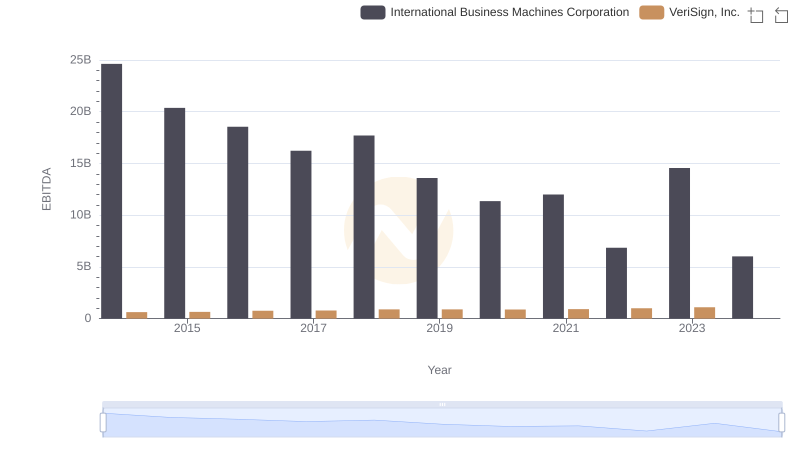
International Business Machines Corporation and VeriSign, Inc.: A Detailed Examination of EBITDA Performance
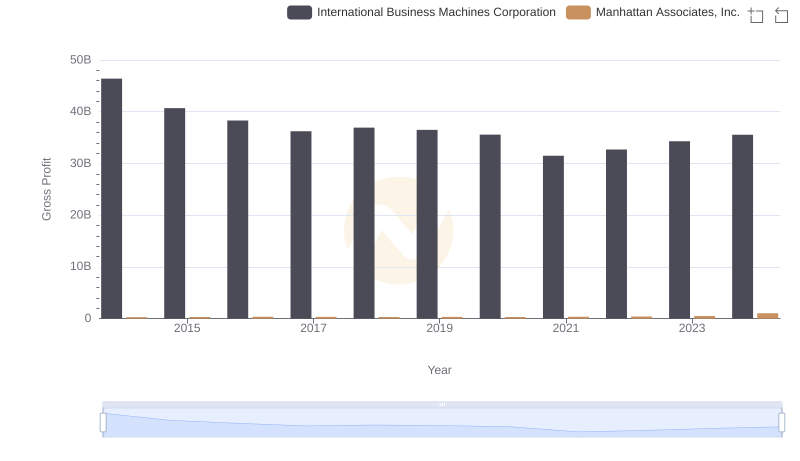
International Business Machines Corporation and Manhattan Associates, Inc.: A Detailed Gross Profit Analysis
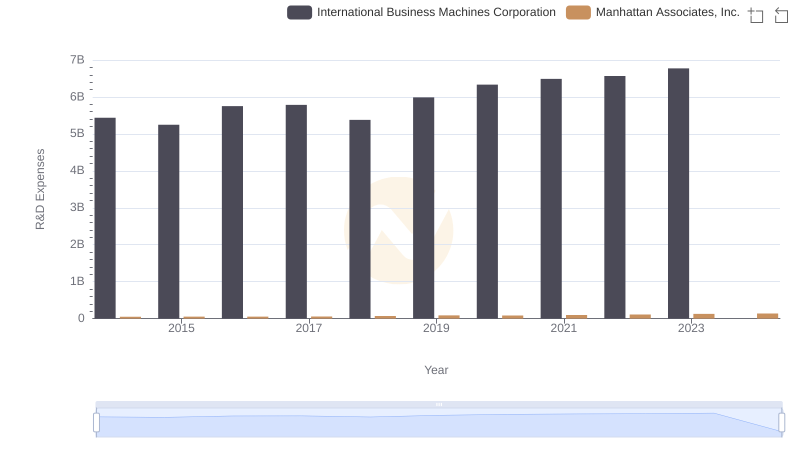
Research and Development: Comparing Key Metrics for International Business Machines Corporation and Manhattan Associates, Inc.
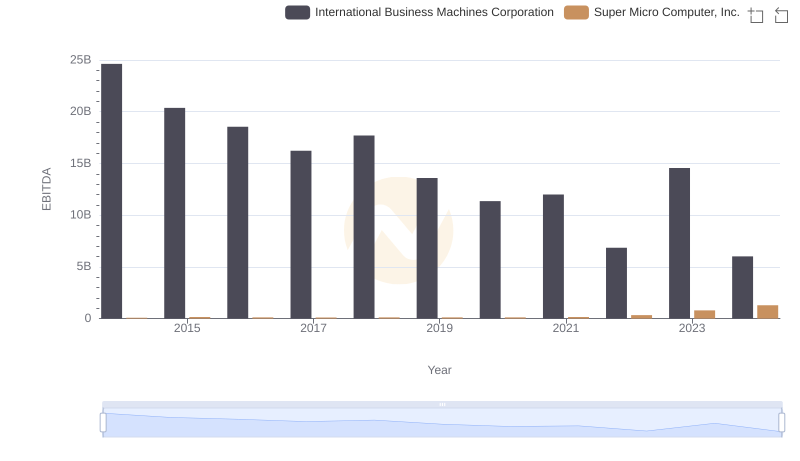
A Side-by-Side Analysis of EBITDA: International Business Machines Corporation and Super Micro Computer, Inc.
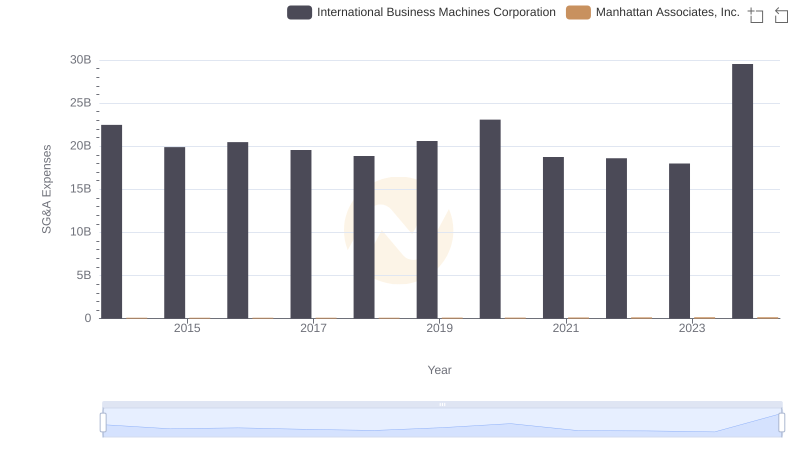
Selling, General, and Administrative Costs: International Business Machines Corporation vs Manhattan Associates, Inc.
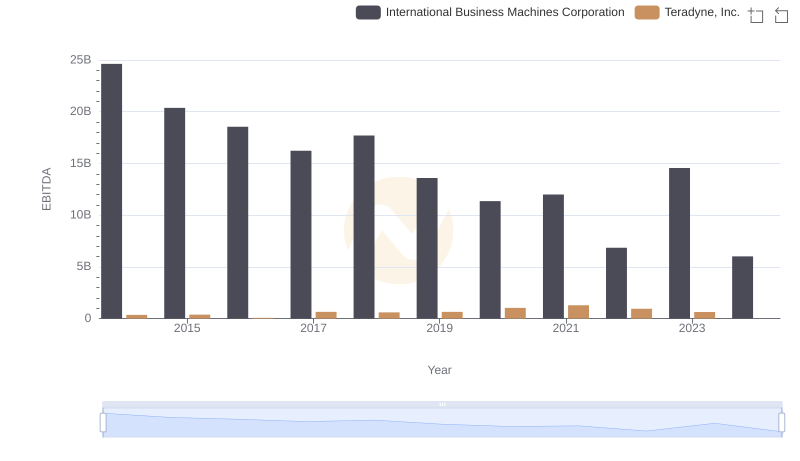
EBITDA Performance Review: International Business Machines Corporation vs Teradyne, Inc.
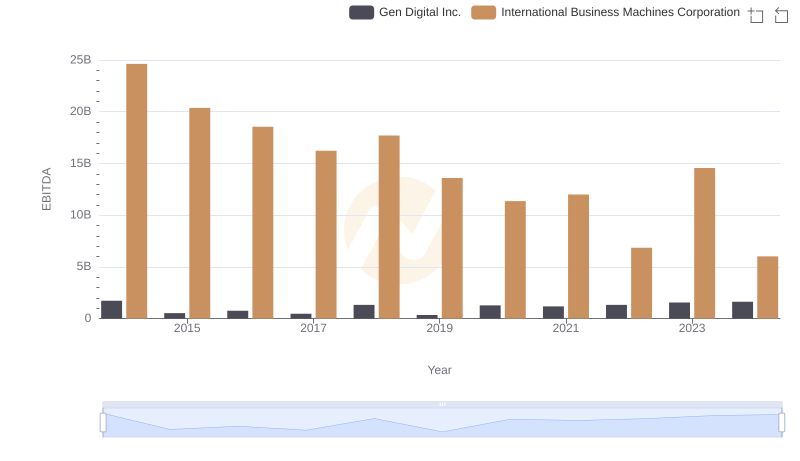
Comprehensive EBITDA Comparison: International Business Machines Corporation vs Gen Digital Inc.
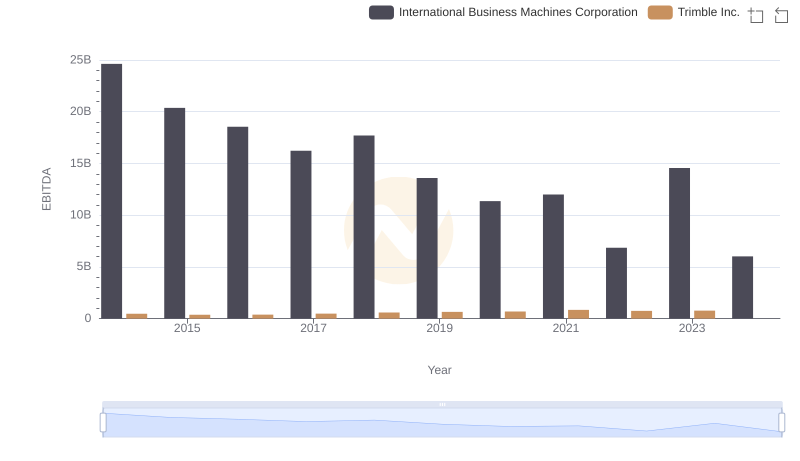
Comparative EBITDA Analysis: International Business Machines Corporation vs Trimble Inc.
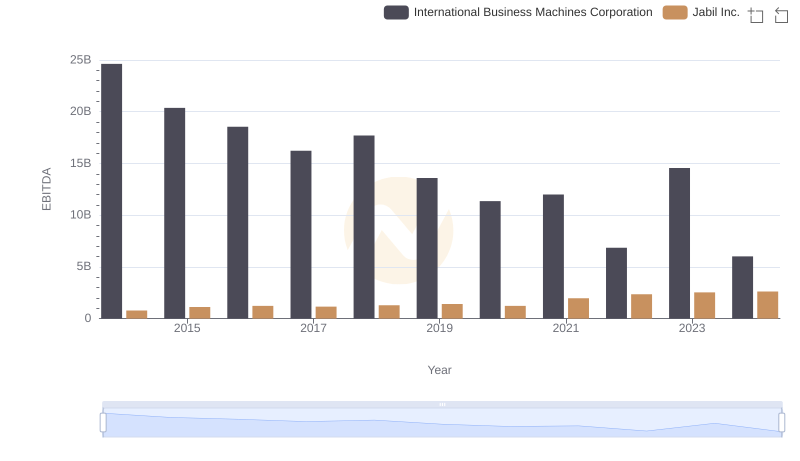
International Business Machines Corporation and Jabil Inc.: A Detailed Examination of EBITDA Performance