| __timestamp | International Business Machines Corporation | Teradyne, Inc. |
|---|---|---|
| Wednesday, January 1, 2014 | 46386000000 | 769016000 |
| Thursday, January 1, 2015 | 41057000000 | 723935000 |
| Friday, January 1, 2016 | 41403000000 | 793683000 |
| Sunday, January 1, 2017 | 42196000000 | 912734000 |
| Monday, January 1, 2018 | 42655000000 | 880408000 |
| Tuesday, January 1, 2019 | 26181000000 | 955136000 |
| Wednesday, January 1, 2020 | 24314000000 | 1335728000 |
| Friday, January 1, 2021 | 25865000000 | 1496225000 |
| Saturday, January 1, 2022 | 27842000000 | 1287894000 |
| Sunday, January 1, 2023 | 27560000000 | 1139550000 |
| Monday, January 1, 2024 | 27202000000 | 1170953000 |
Igniting the spark of knowledge
In the ever-evolving landscape of technology, understanding cost dynamics is crucial. From 2014 to 2023, International Business Machines Corporation (IBM) and Teradyne, Inc. have showcased distinct cost of revenue trends. IBM, a stalwart in the tech industry, saw its cost of revenue peak in 2014, with a gradual decline of approximately 41% by 2023. This trend reflects IBM's strategic shift towards more efficient operations and a focus on high-margin services.
Conversely, Teradyne, a leader in automation equipment, experienced a steady increase in its cost of revenue, peaking in 2021 with a 95% rise from 2014. This growth aligns with Teradyne's expansion in the semiconductor and robotics sectors. Notably, data for 2024 is incomplete, indicating potential shifts in these trends. As the tech industry continues to innovate, monitoring these financial metrics offers valuable insights into corporate strategies and market positioning.
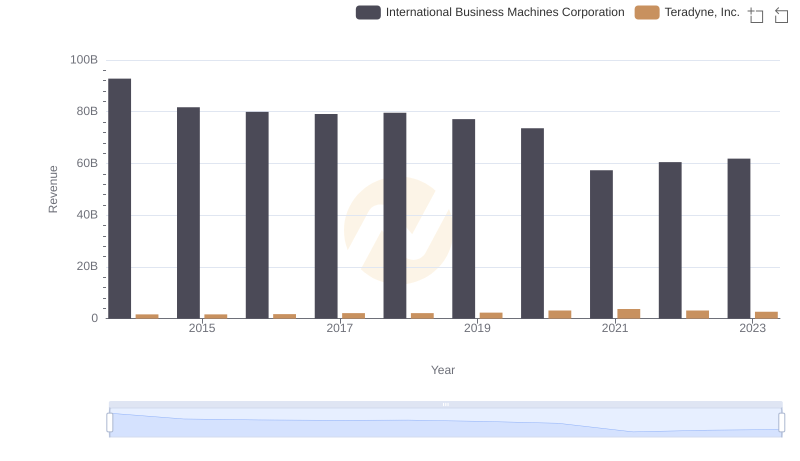
Annual Revenue Comparison: International Business Machines Corporation vs Teradyne, Inc.
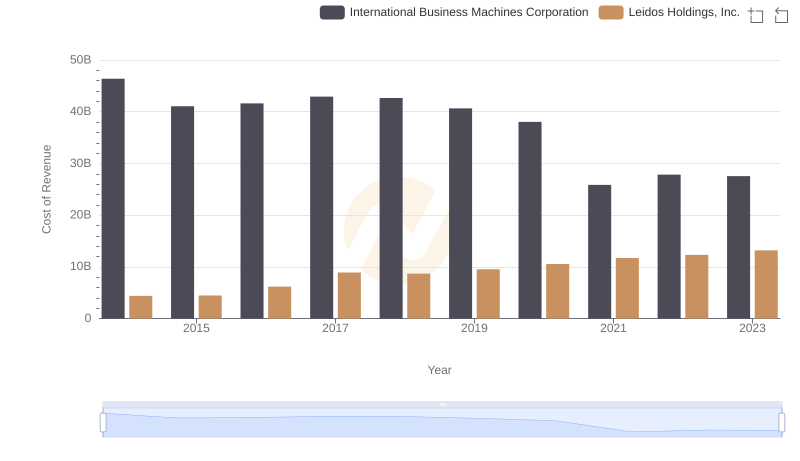
International Business Machines Corporation vs Leidos Holdings, Inc.: Efficiency in Cost of Revenue Explored
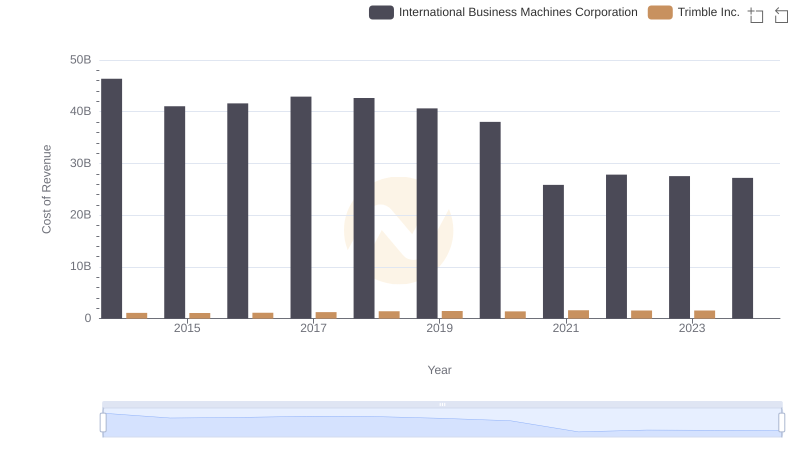
International Business Machines Corporation vs Trimble Inc.: Efficiency in Cost of Revenue Explored
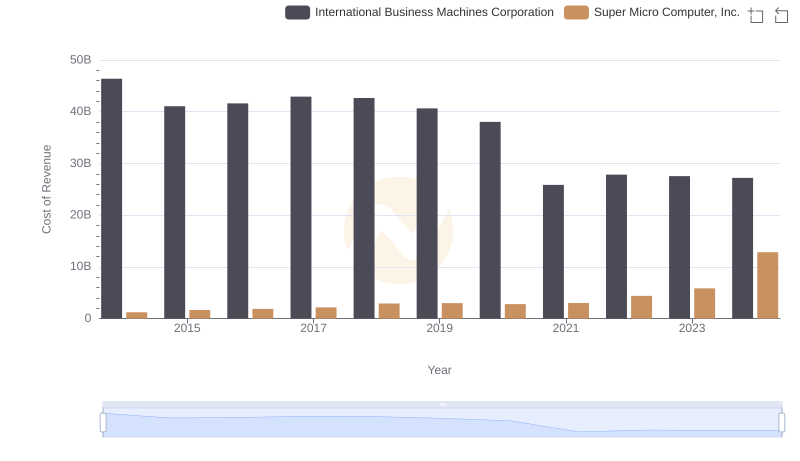
Cost of Revenue Trends: International Business Machines Corporation vs Super Micro Computer, Inc.
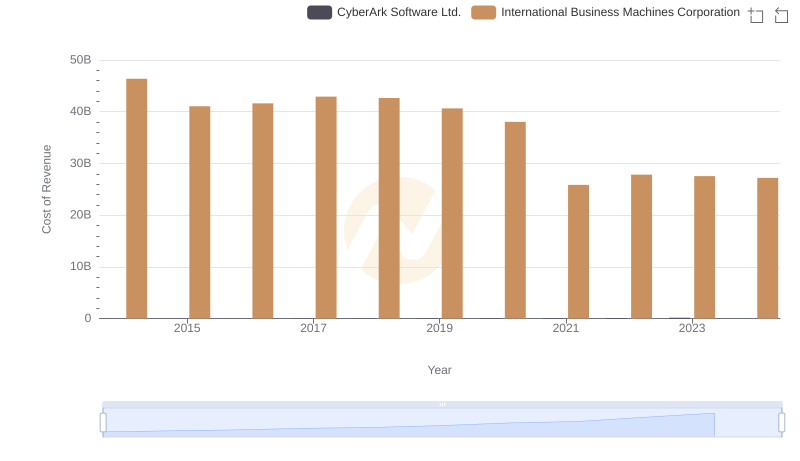
International Business Machines Corporation vs CyberArk Software Ltd.: Efficiency in Cost of Revenue Explored
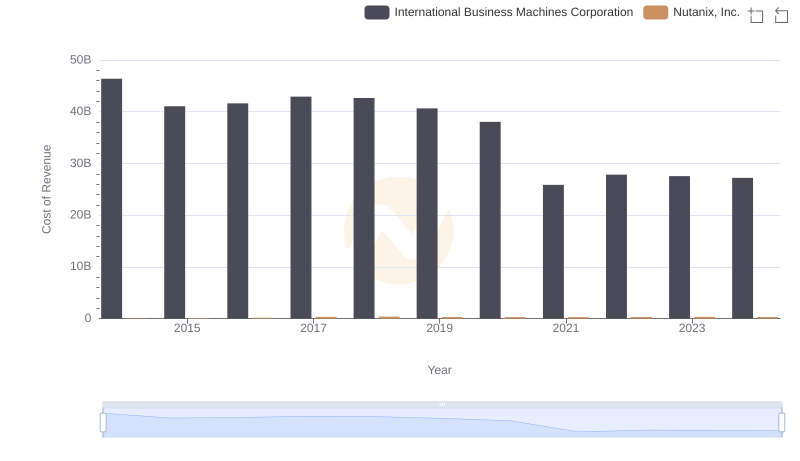
Analyzing Cost of Revenue: International Business Machines Corporation and Nutanix, Inc.
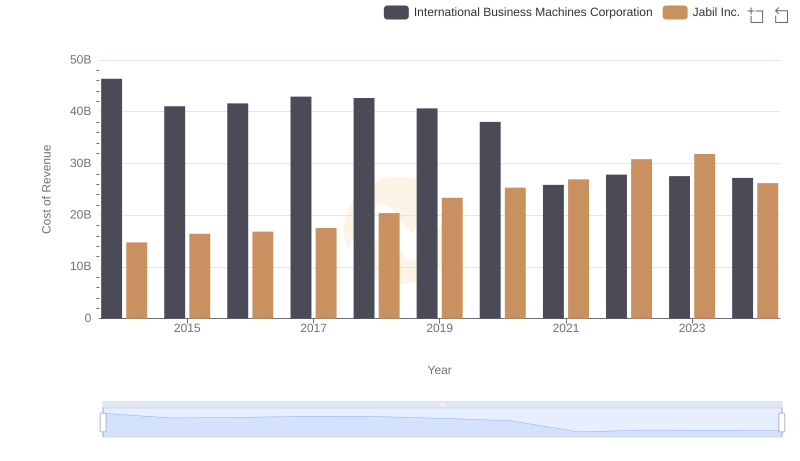
Analyzing Cost of Revenue: International Business Machines Corporation and Jabil Inc.
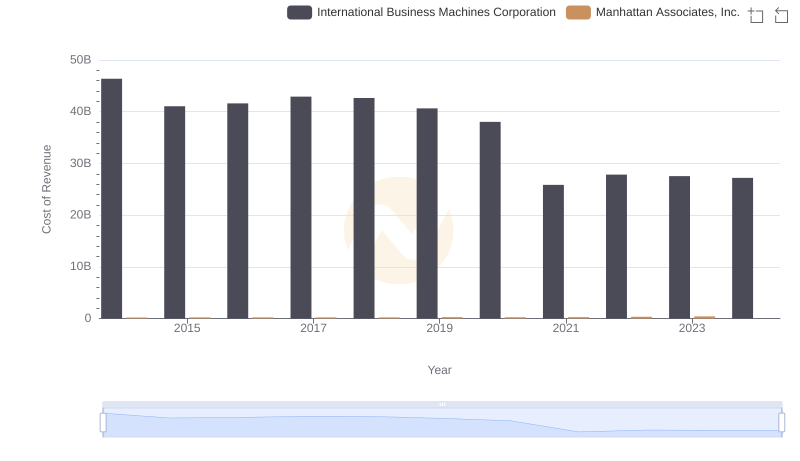
Comparing Cost of Revenue Efficiency: International Business Machines Corporation vs Manhattan Associates, Inc.
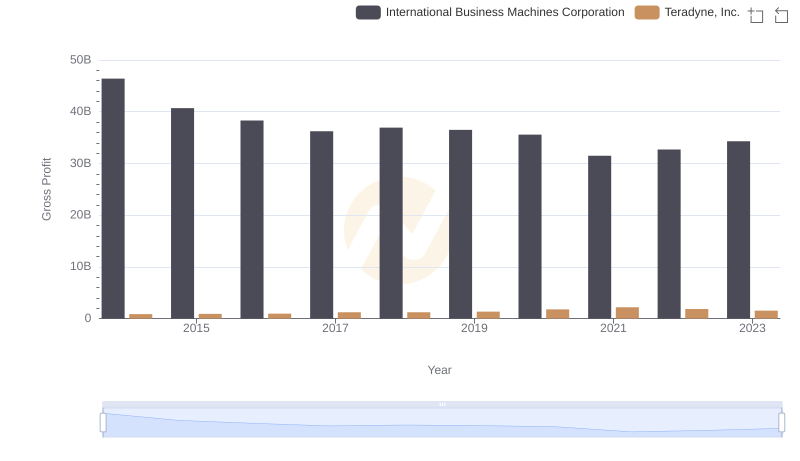
Key Insights on Gross Profit: International Business Machines Corporation vs Teradyne, Inc.
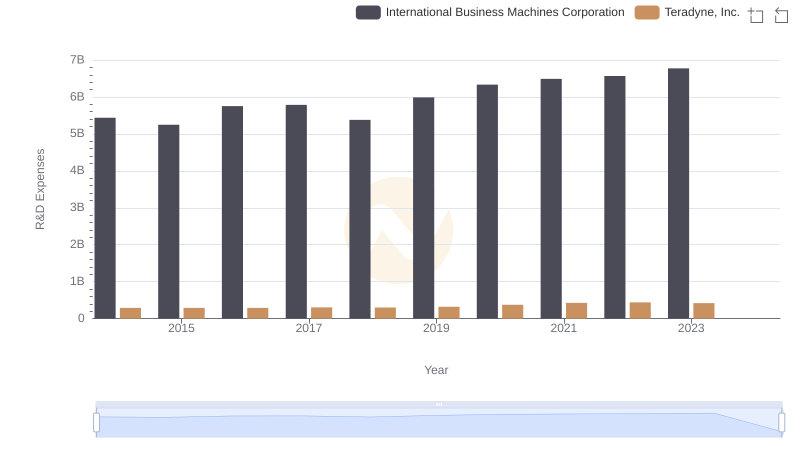
R&D Spending Showdown: International Business Machines Corporation vs Teradyne, Inc.
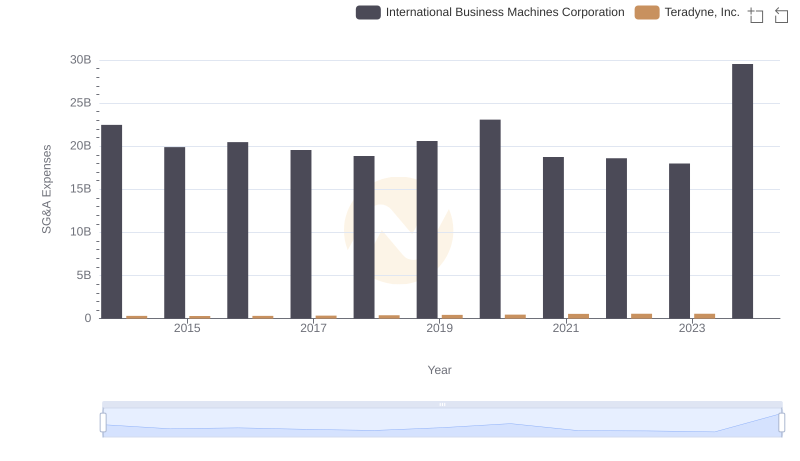
Selling, General, and Administrative Costs: International Business Machines Corporation vs Teradyne, Inc.
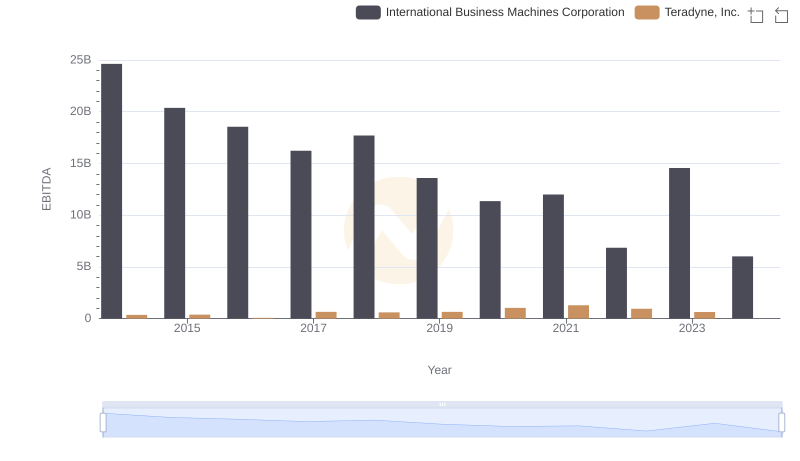
EBITDA Performance Review: International Business Machines Corporation vs Teradyne, Inc.