| __timestamp | Gen Digital Inc. | International Business Machines Corporation |
|---|---|---|
| Wednesday, January 1, 2014 | 1731000000 | 24962000000 |
| Thursday, January 1, 2015 | 530000000 | 20268000000 |
| Friday, January 1, 2016 | 766000000 | 17341000000 |
| Sunday, January 1, 2017 | 476000000 | 16556000000 |
| Monday, January 1, 2018 | 1333000000 | 16545000000 |
| Tuesday, January 1, 2019 | 350000000 | 14609000000 |
| Wednesday, January 1, 2020 | 1286000000 | 10555000000 |
| Friday, January 1, 2021 | 1188000000 | 12409000000 |
| Saturday, January 1, 2022 | 1328000000 | 7174000000 |
| Sunday, January 1, 2023 | 1557000000 | 14693000000 |
| Monday, January 1, 2024 | 1629000000 | 6015000000 |
Cracking the code
In the ever-evolving landscape of technology, the financial health of companies is a key indicator of their resilience and adaptability. Over the past decade, International Business Machines Corporation (IBM) and Gen Digital Inc. have showcased contrasting EBITDA trajectories. IBM, a stalwart in the tech industry, saw its EBITDA peak in 2014, only to experience a gradual decline, dropping by nearly 75% by 2022. This decline reflects the challenges faced by legacy tech giants in adapting to new market dynamics.
Conversely, Gen Digital Inc. has demonstrated a remarkable turnaround. From a low in 2019, its EBITDA surged by over 350% by 2023, highlighting its strategic pivots and growth in digital solutions. This comparison underscores the dynamic nature of the tech industry, where agility and innovation are paramount for sustained success.
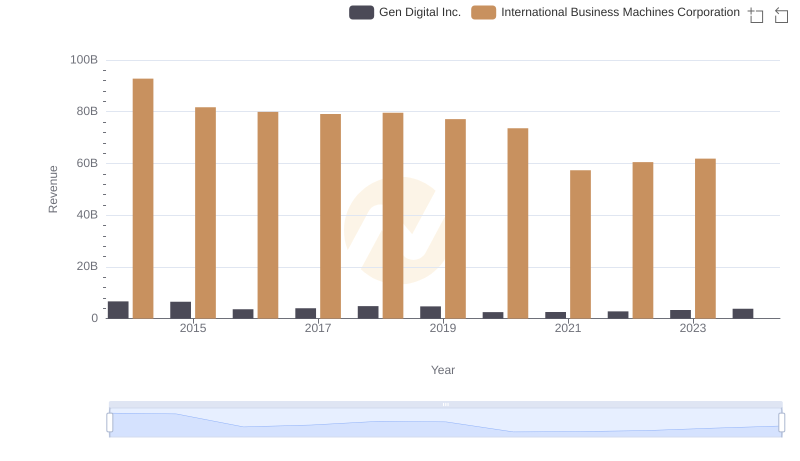
Revenue Insights: International Business Machines Corporation and Gen Digital Inc. Performance Compared
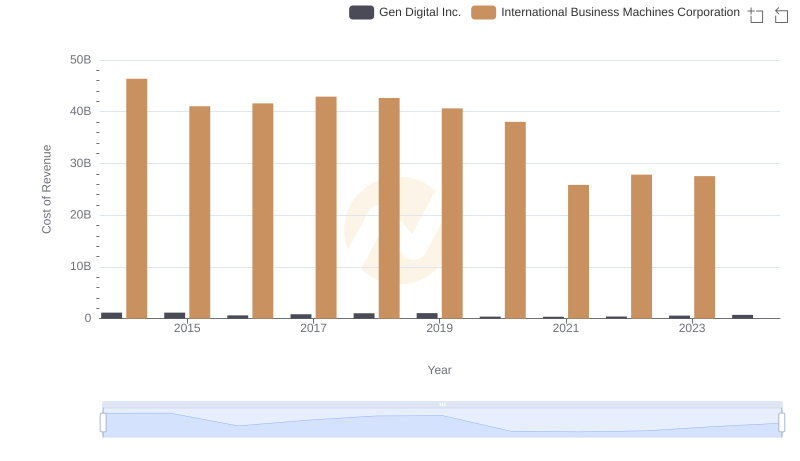
Cost of Revenue Trends: International Business Machines Corporation vs Gen Digital Inc.
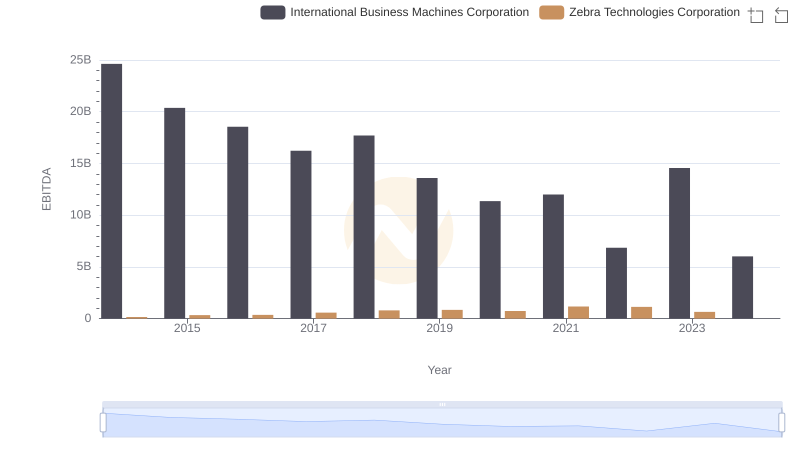
A Side-by-Side Analysis of EBITDA: International Business Machines Corporation and Zebra Technologies Corporation
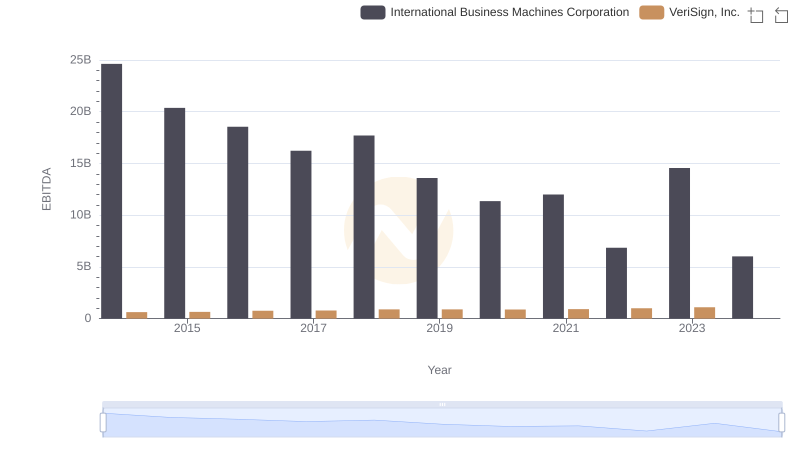
International Business Machines Corporation and VeriSign, Inc.: A Detailed Examination of EBITDA Performance
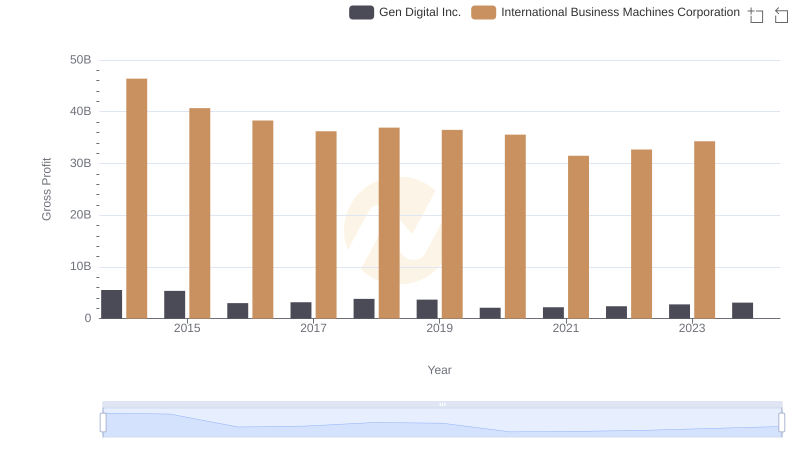
Gross Profit Analysis: Comparing International Business Machines Corporation and Gen Digital Inc.
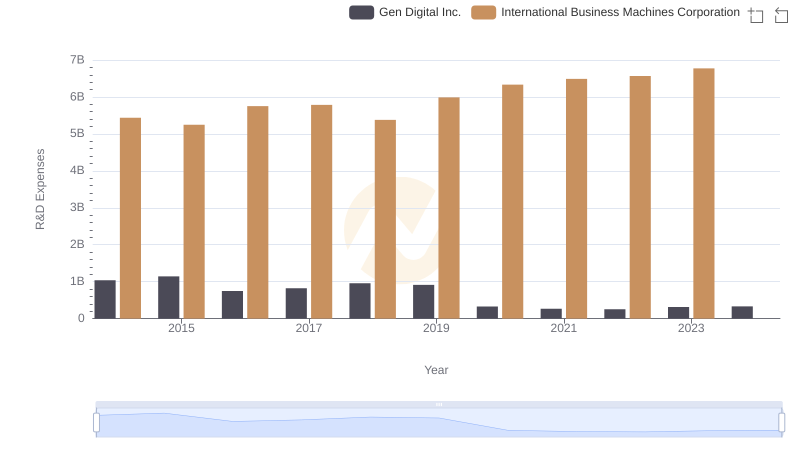
International Business Machines Corporation or Gen Digital Inc.: Who Invests More in Innovation?
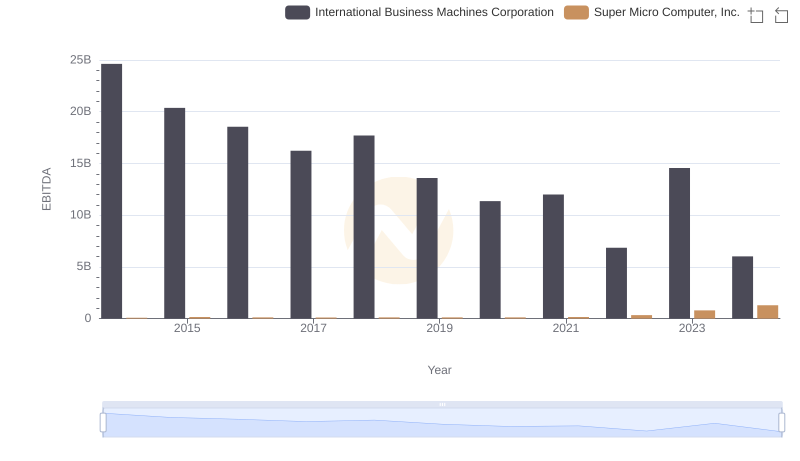
A Side-by-Side Analysis of EBITDA: International Business Machines Corporation and Super Micro Computer, Inc.
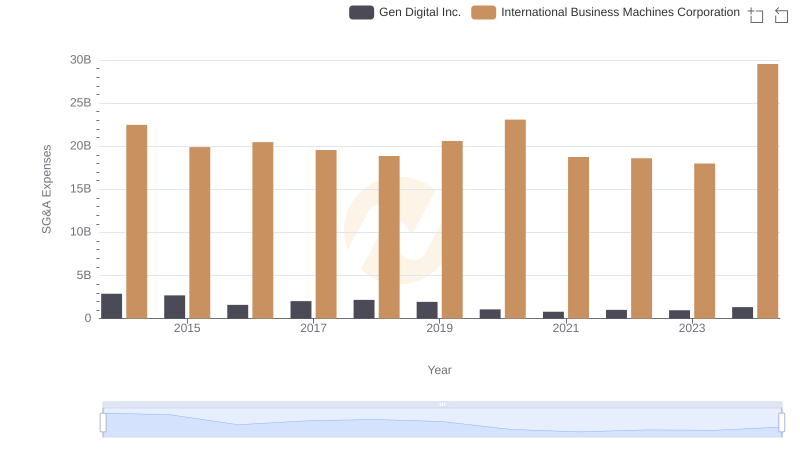
Selling, General, and Administrative Costs: International Business Machines Corporation vs Gen Digital Inc.
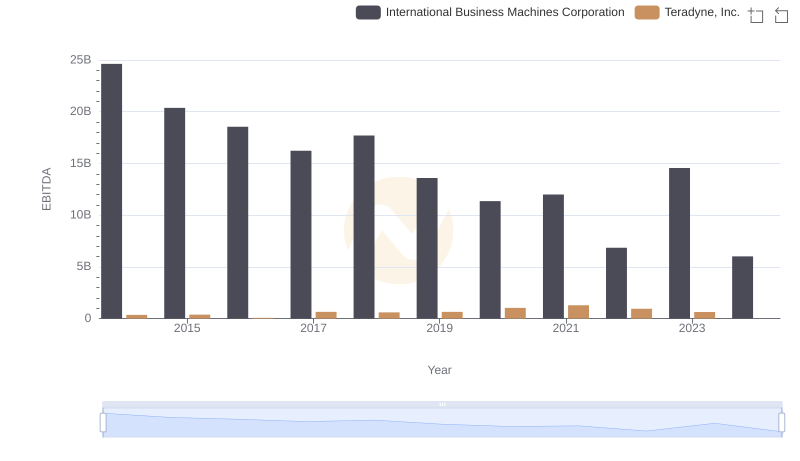
EBITDA Performance Review: International Business Machines Corporation vs Teradyne, Inc.
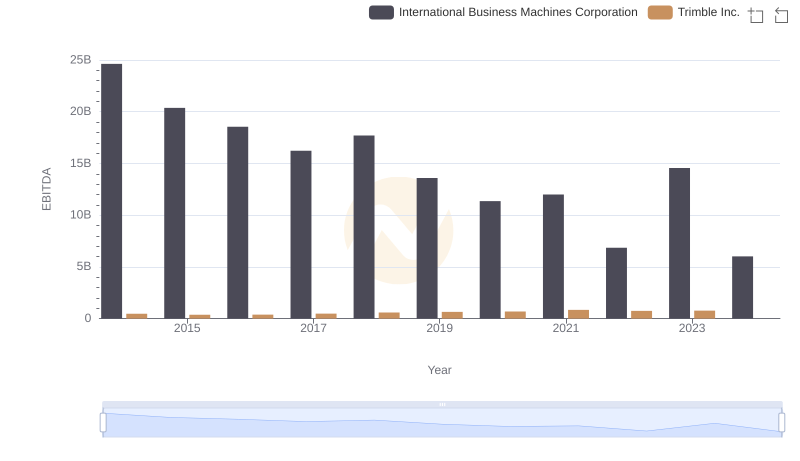
Comparative EBITDA Analysis: International Business Machines Corporation vs Trimble Inc.
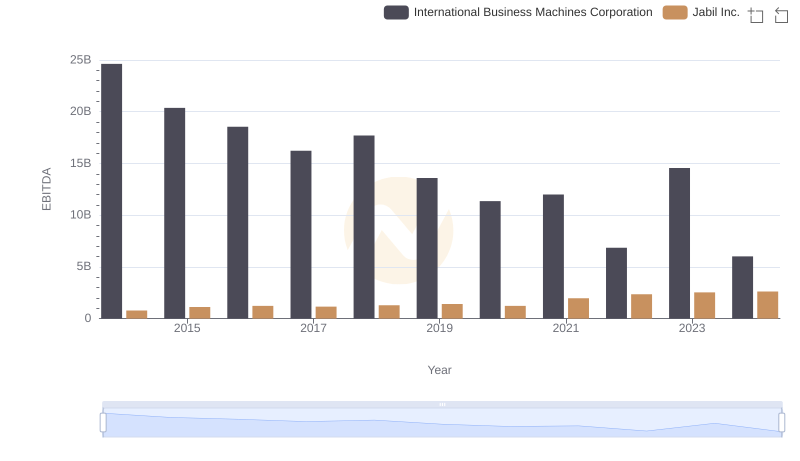
International Business Machines Corporation and Jabil Inc.: A Detailed Examination of EBITDA Performance
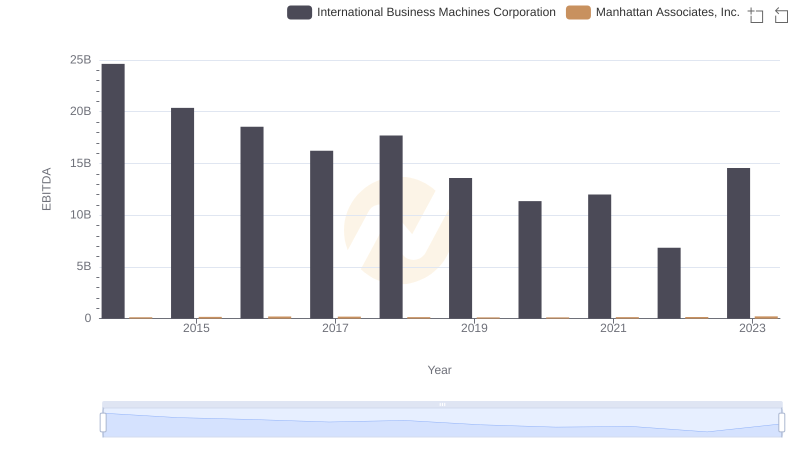
EBITDA Performance Review: International Business Machines Corporation vs Manhattan Associates, Inc.