| __timestamp | International Business Machines Corporation | Teradyne, Inc. |
|---|---|---|
| Wednesday, January 1, 2014 | 46407000000 | 878808000 |
| Thursday, January 1, 2015 | 40684000000 | 915643000 |
| Friday, January 1, 2016 | 38516000000 | 959567000 |
| Sunday, January 1, 2017 | 36943000000 | 1223872000 |
| Monday, January 1, 2018 | 36936000000 | 1220394000 |
| Tuesday, January 1, 2019 | 31533000000 | 1339829000 |
| Wednesday, January 1, 2020 | 30865000000 | 1785741000 |
| Friday, January 1, 2021 | 31486000000 | 2206656000 |
| Saturday, January 1, 2022 | 32687000000 | 1867151000 |
| Sunday, January 1, 2023 | 34300000000 | 1536748000 |
| Monday, January 1, 2024 | 35551000000 | 1648927000 |
Igniting the spark of knowledge
In the ever-evolving landscape of technology, the financial performance of industry giants like International Business Machines Corporation (IBM) and Teradyne, Inc. offers a fascinating glimpse into their strategic maneuvers. Over the past decade, IBM's gross profit has seen a notable decline of approximately 26%, from a peak in 2014 to a low in 2021. This trend reflects the company's ongoing transformation and adaptation to new market demands.
Conversely, Teradyne, Inc. has experienced a robust growth trajectory, with its gross profit more than doubling since 2014. This impressive 151% increase underscores Teradyne's successful expansion in the semiconductor testing market. As we look to the future, these trends highlight the dynamic nature of the tech industry and the importance of strategic innovation.
Stay tuned as we continue to explore the financial narratives shaping the world of technology.
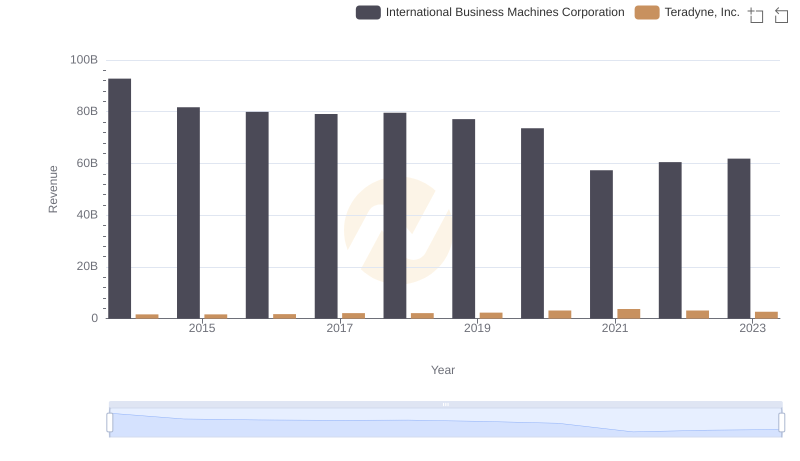
Annual Revenue Comparison: International Business Machines Corporation vs Teradyne, Inc.
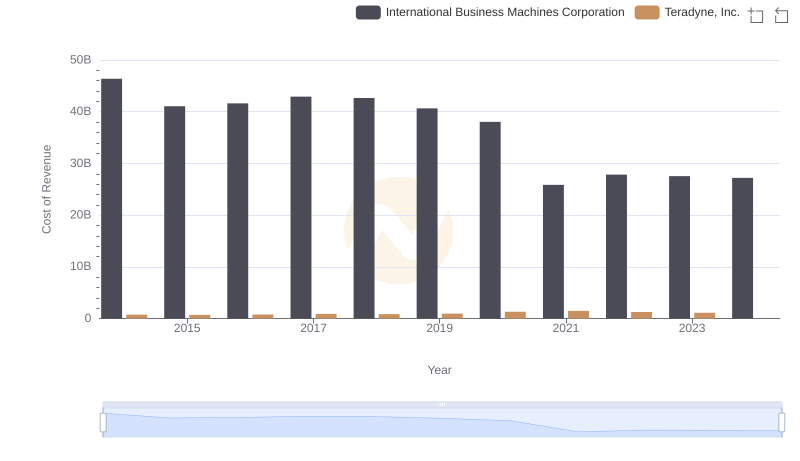
Cost of Revenue Trends: International Business Machines Corporation vs Teradyne, Inc.
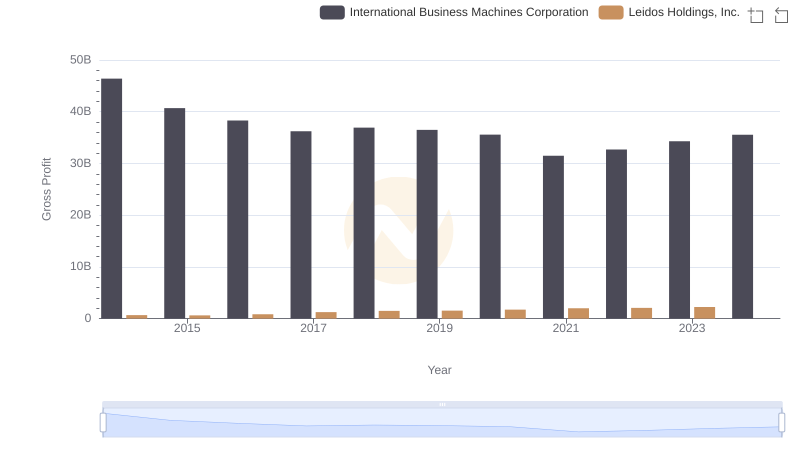
Gross Profit Analysis: Comparing International Business Machines Corporation and Leidos Holdings, Inc.
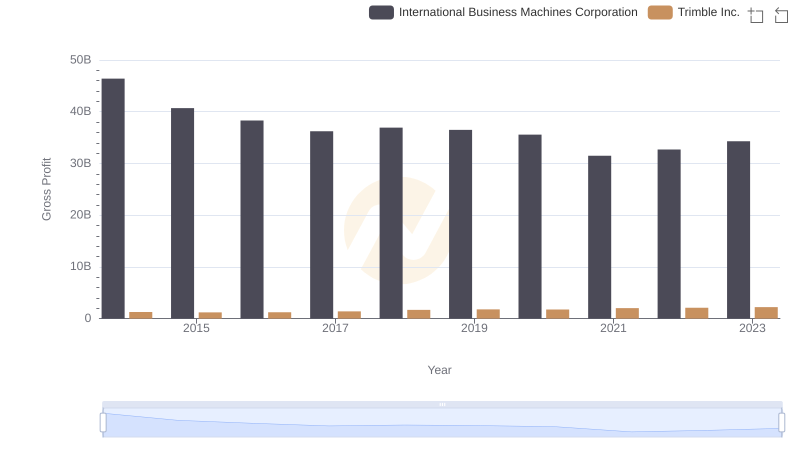
Gross Profit Trends Compared: International Business Machines Corporation vs Trimble Inc.
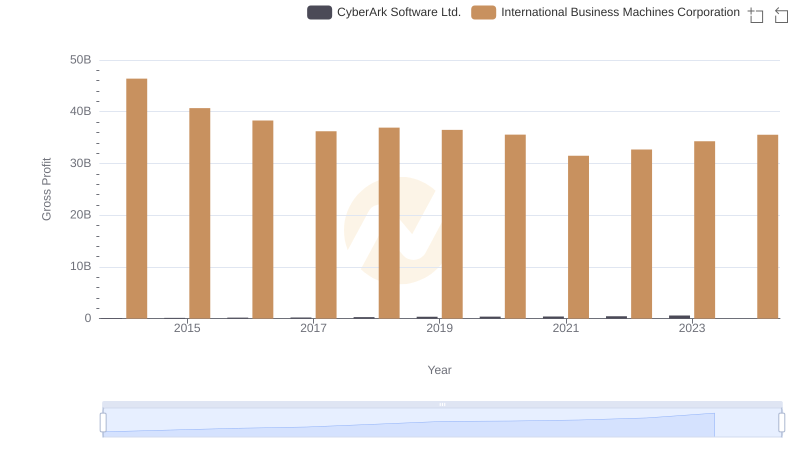
Who Generates Higher Gross Profit? International Business Machines Corporation or CyberArk Software Ltd.
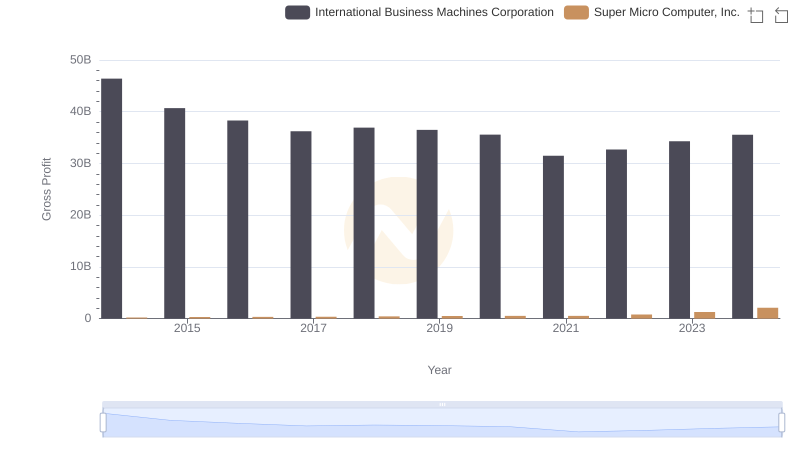
International Business Machines Corporation and Super Micro Computer, Inc.: A Detailed Gross Profit Analysis
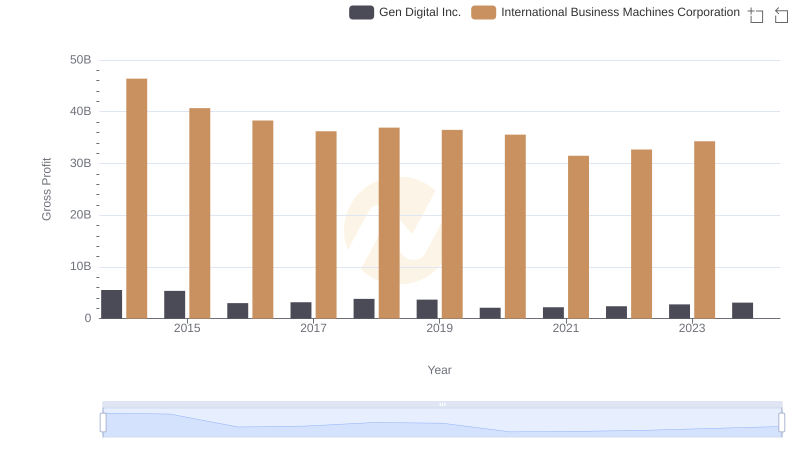
Gross Profit Analysis: Comparing International Business Machines Corporation and Gen Digital Inc.

Gross Profit Analysis: Comparing International Business Machines Corporation and Nutanix, Inc.
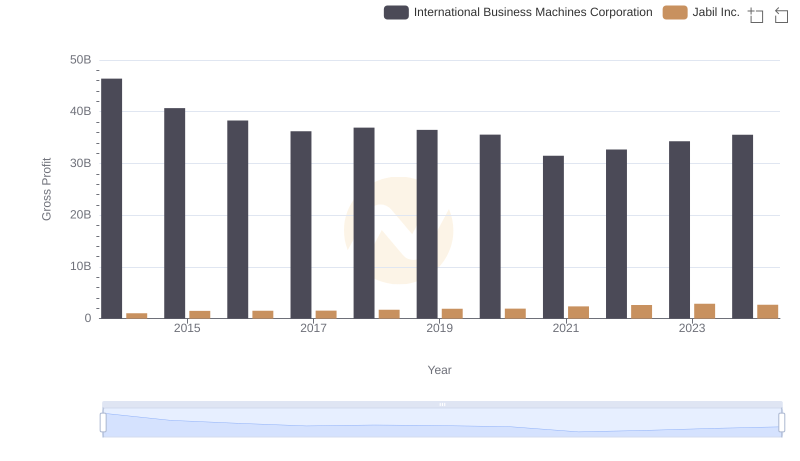
International Business Machines Corporation and Jabil Inc.: A Detailed Gross Profit Analysis
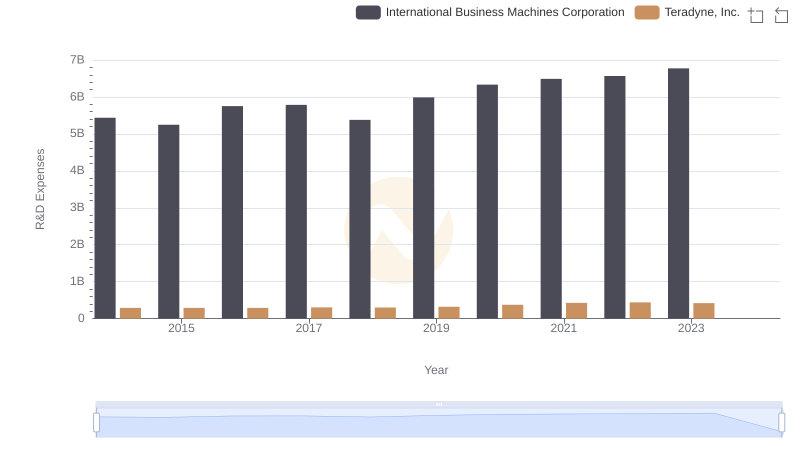
R&D Spending Showdown: International Business Machines Corporation vs Teradyne, Inc.
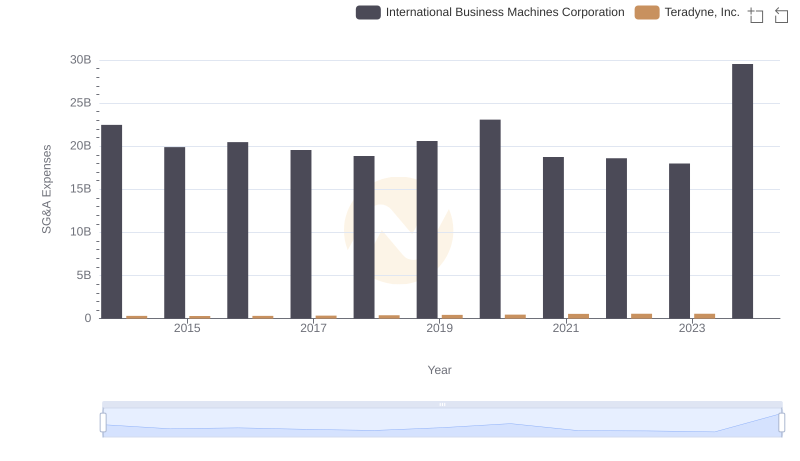
Selling, General, and Administrative Costs: International Business Machines Corporation vs Teradyne, Inc.
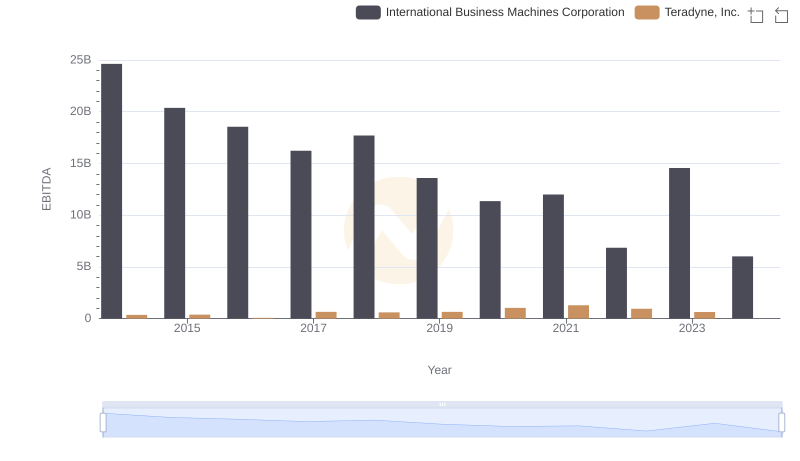
EBITDA Performance Review: International Business Machines Corporation vs Teradyne, Inc.