| __timestamp | International Business Machines Corporation | Trimble Inc. |
|---|---|---|
| Wednesday, January 1, 2014 | 24962000000 | 476337000 |
| Thursday, January 1, 2015 | 20268000000 | 376200000 |
| Friday, January 1, 2016 | 17341000000 | 388300000 |
| Sunday, January 1, 2017 | 16556000000 | 478100000 |
| Monday, January 1, 2018 | 16545000000 | 590000000 |
| Tuesday, January 1, 2019 | 14609000000 | 656700000 |
| Wednesday, January 1, 2020 | 10555000000 | 692900000 |
| Friday, January 1, 2021 | 12409000000 | 845800000 |
| Saturday, January 1, 2022 | 7174000000 | 747400000 |
| Sunday, January 1, 2023 | 14693000000 | 768600000 |
| Monday, January 1, 2024 | 6015000000 |
Data in motion
In the ever-evolving landscape of technology and innovation, International Business Machines Corporation (IBM) and Trimble Inc. stand as titans in their respective domains. Over the past decade, IBM's EBITDA has showcased a dynamic journey, peaking in 2014 with a remarkable 24.6 billion USD, before experiencing fluctuations and settling at approximately 14.6 billion USD in 2023. This represents a 41% decrease from its peak, reflecting the challenges and transformations within the tech giant.
Conversely, Trimble Inc., a leader in geospatial solutions, has demonstrated steady growth. From 2014 to 2023, Trimble's EBITDA increased by 61%, reaching around 768 million USD. This growth trajectory highlights Trimble's strategic advancements and market adaptability.
While IBM's data for 2024 remains incomplete, the comparative analysis underscores the contrasting paths of these industry leaders, offering valuable insights into their financial health and strategic directions.
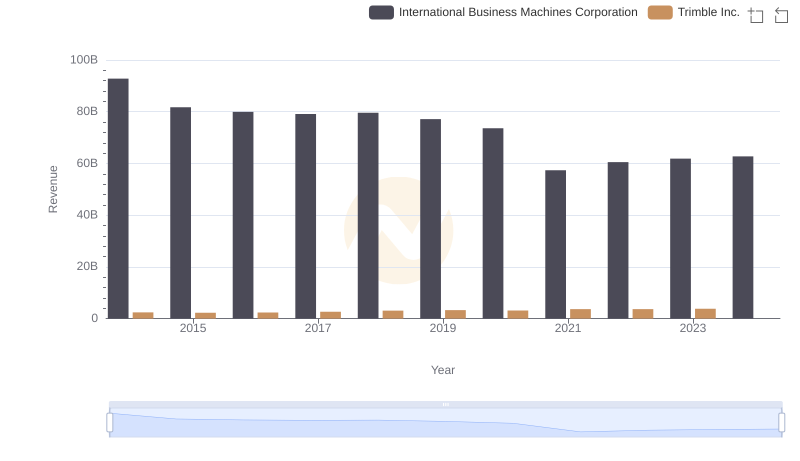
International Business Machines Corporation or Trimble Inc.: Who Leads in Yearly Revenue?
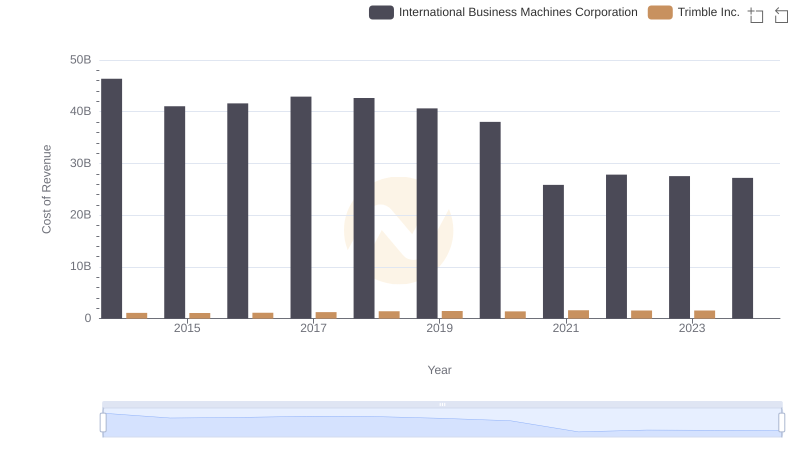
International Business Machines Corporation vs Trimble Inc.: Efficiency in Cost of Revenue Explored
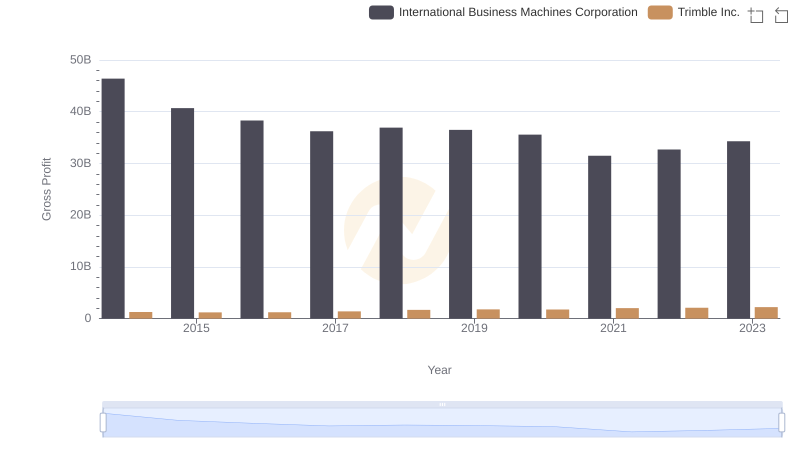
Gross Profit Trends Compared: International Business Machines Corporation vs Trimble Inc.
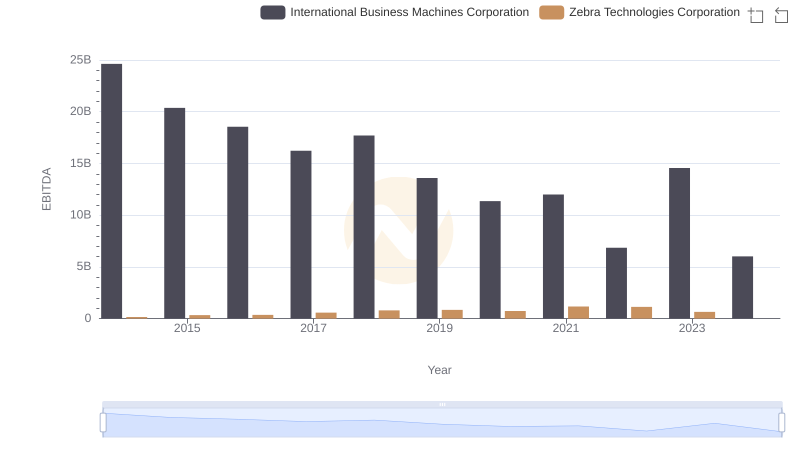
A Side-by-Side Analysis of EBITDA: International Business Machines Corporation and Zebra Technologies Corporation
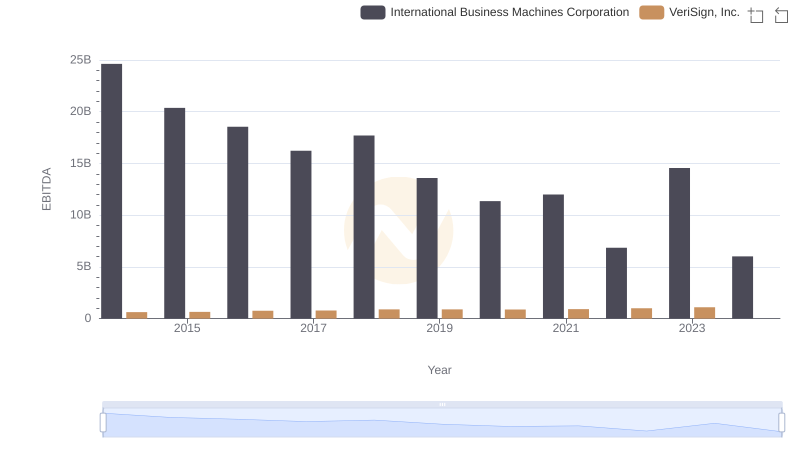
International Business Machines Corporation and VeriSign, Inc.: A Detailed Examination of EBITDA Performance
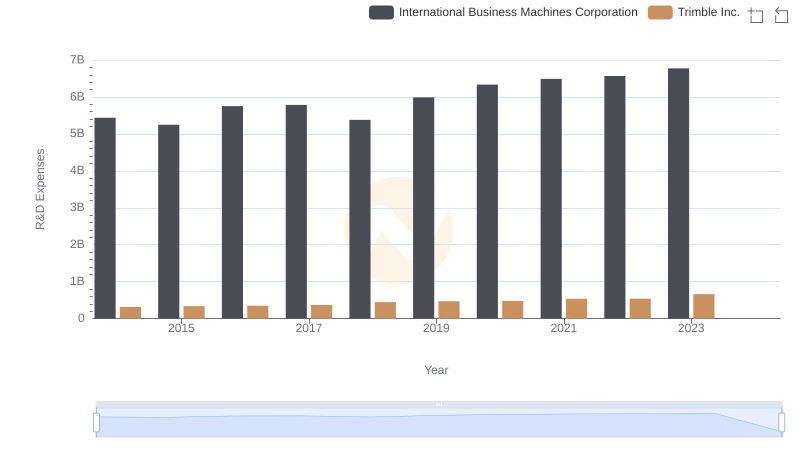
Analyzing R&D Budgets: International Business Machines Corporation vs Trimble Inc.
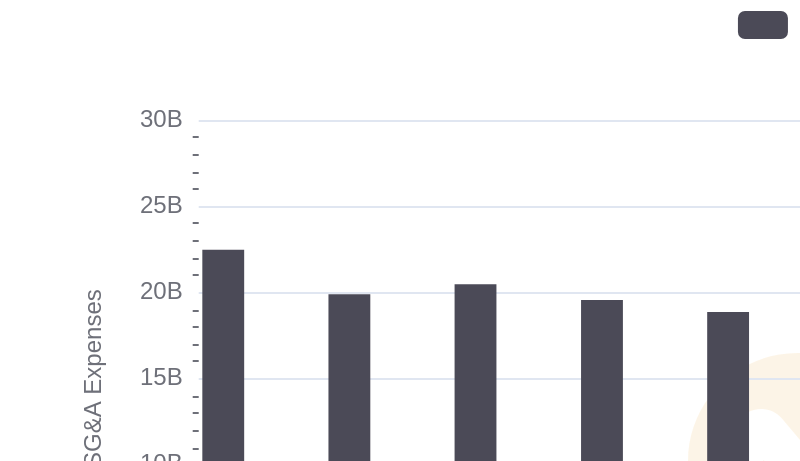
Breaking Down SG&A Expenses: International Business Machines Corporation vs Trimble Inc.
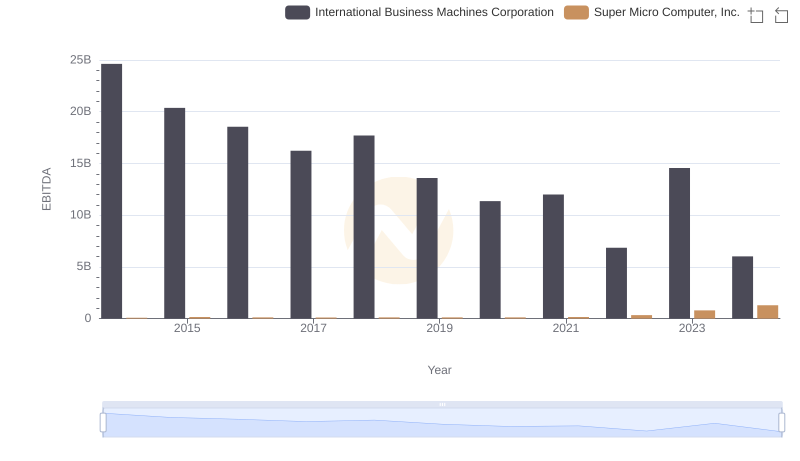
A Side-by-Side Analysis of EBITDA: International Business Machines Corporation and Super Micro Computer, Inc.
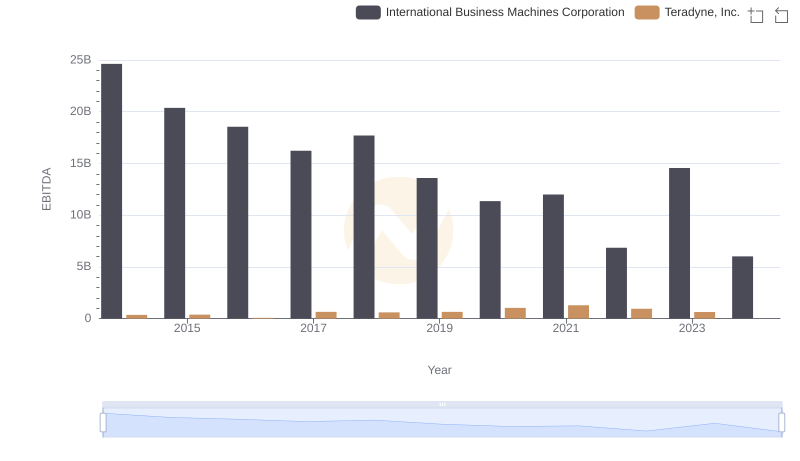
EBITDA Performance Review: International Business Machines Corporation vs Teradyne, Inc.
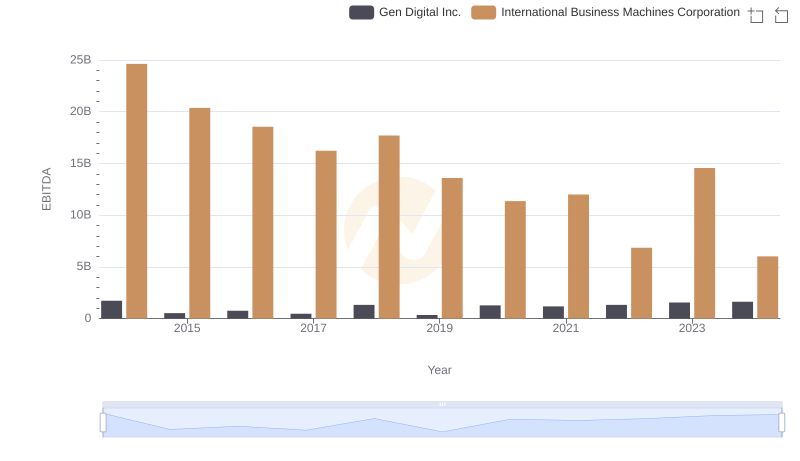
Comprehensive EBITDA Comparison: International Business Machines Corporation vs Gen Digital Inc.
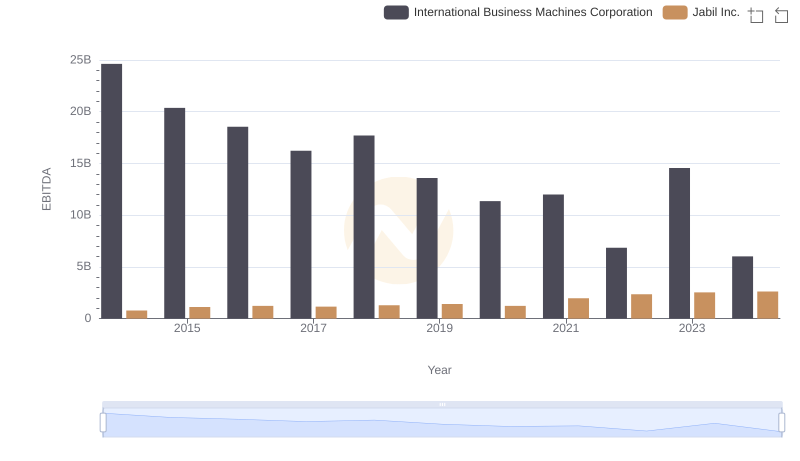
International Business Machines Corporation and Jabil Inc.: A Detailed Examination of EBITDA Performance
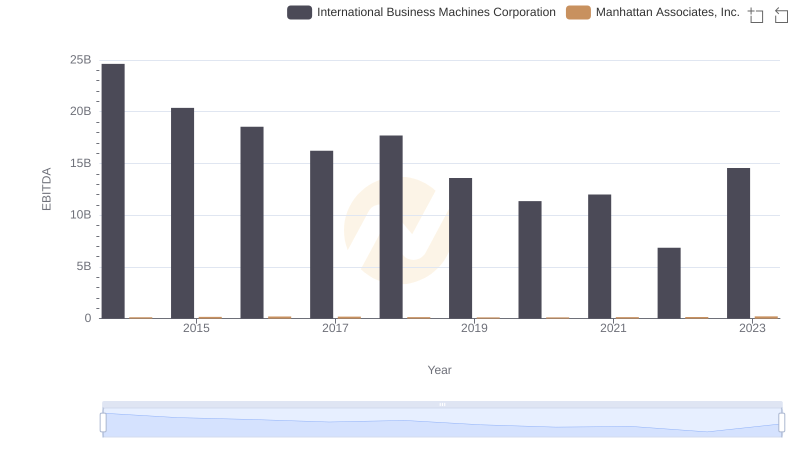
EBITDA Performance Review: International Business Machines Corporation vs Manhattan Associates, Inc.