| __timestamp | International Business Machines Corporation | Super Micro Computer, Inc. |
|---|---|---|
| Wednesday, January 1, 2014 | 24962000000 | 86715000 |
| Thursday, January 1, 2015 | 20268000000 | 154994000 |
| Friday, January 1, 2016 | 17341000000 | 120773000 |
| Sunday, January 1, 2017 | 16556000000 | 111232000 |
| Monday, January 1, 2018 | 16545000000 | 115787000 |
| Tuesday, January 1, 2019 | 14609000000 | 120415000 |
| Wednesday, January 1, 2020 | 10555000000 | 114126000 |
| Friday, January 1, 2021 | 12409000000 | 152132000 |
| Saturday, January 1, 2022 | 7174000000 | 335167000 |
| Sunday, January 1, 2023 | 14693000000 | 796046000 |
| Monday, January 1, 2024 | 6015000000 | 1288409000 |
Unlocking the unknown
In the ever-evolving tech industry, financial performance is a key indicator of a company's resilience and adaptability. Over the past decade, International Business Machines Corporation (IBM) and Super Micro Computer, Inc. have showcased contrasting trajectories in their EBITDA figures. IBM, a stalwart in the tech world, saw its EBITDA peak in 2014, only to experience a gradual decline, reaching a low in 2022. However, 2023 marked a resurgence with a 112% increase from the previous year. In contrast, Super Micro Computer, Inc. has demonstrated a steady upward trend, with its EBITDA growing by over 1,300% from 2014 to 2024. This growth highlights Super Micro's agility and strategic positioning in the market. As we look to the future, these trends offer valuable insights into the competitive dynamics of the tech industry.
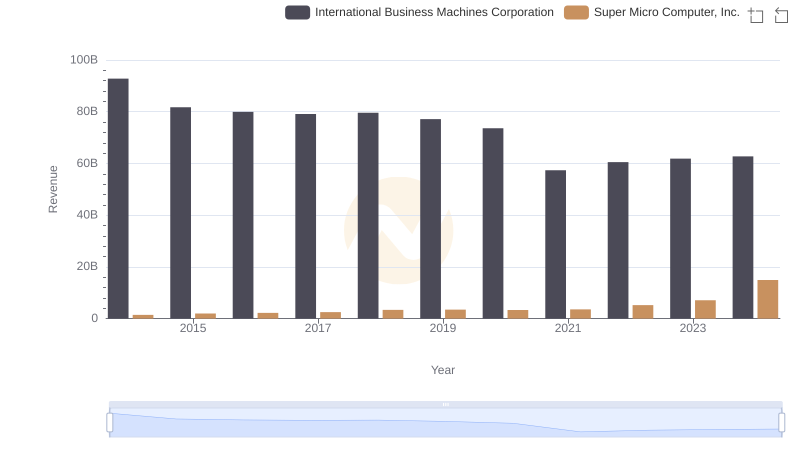
International Business Machines Corporation or Super Micro Computer, Inc.: Who Leads in Yearly Revenue?
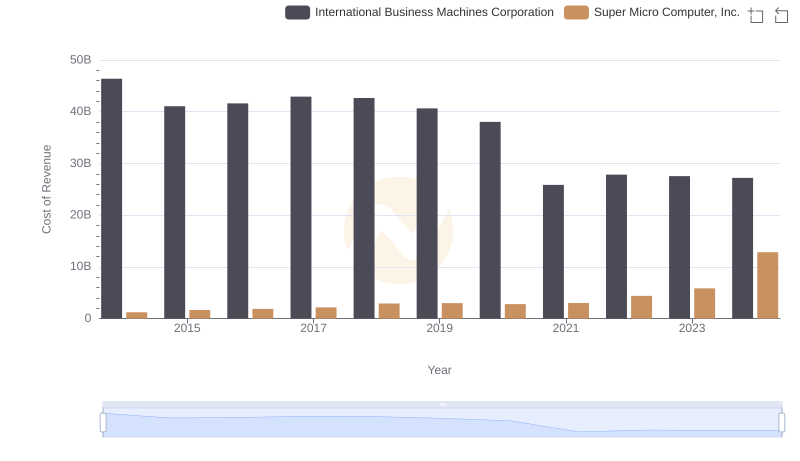
Cost of Revenue Trends: International Business Machines Corporation vs Super Micro Computer, Inc.
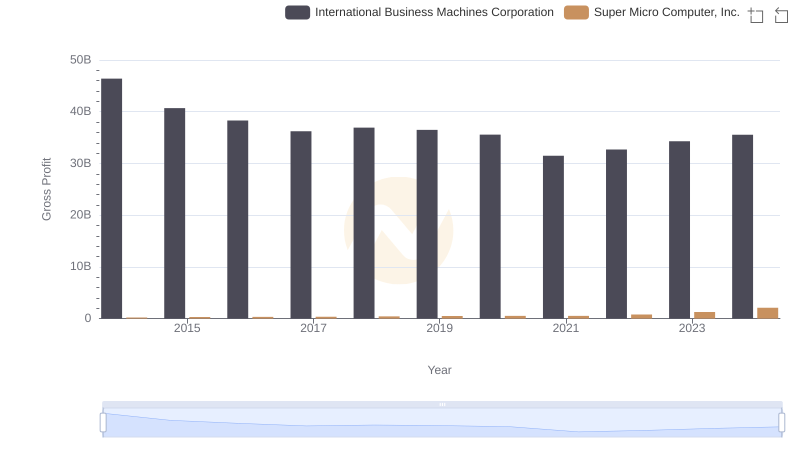
International Business Machines Corporation and Super Micro Computer, Inc.: A Detailed Gross Profit Analysis
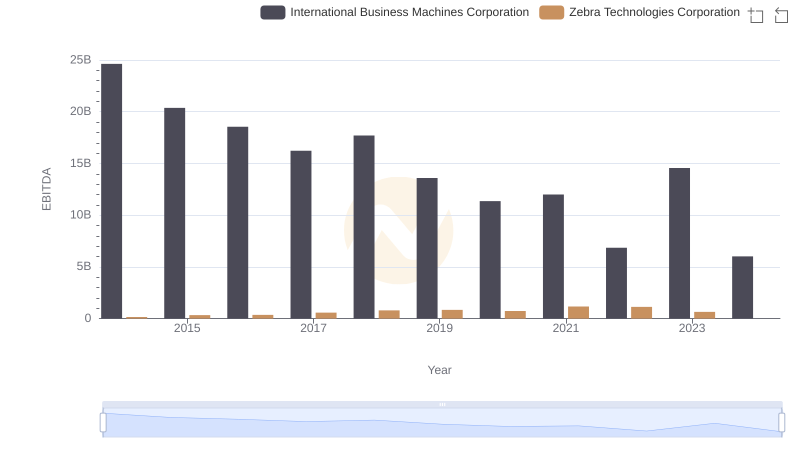
A Side-by-Side Analysis of EBITDA: International Business Machines Corporation and Zebra Technologies Corporation
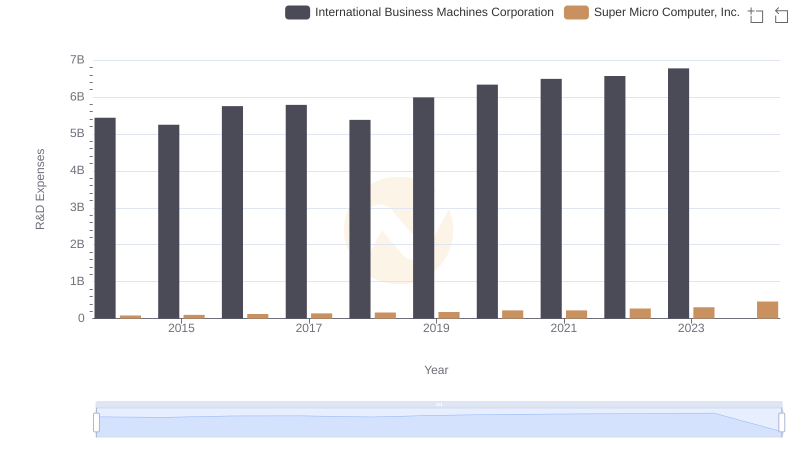
R&D Spending Showdown: International Business Machines Corporation vs Super Micro Computer, Inc.
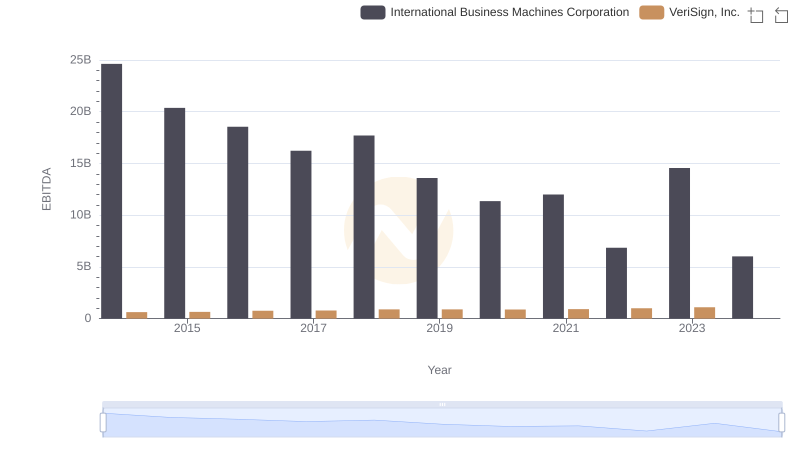
International Business Machines Corporation and VeriSign, Inc.: A Detailed Examination of EBITDA Performance
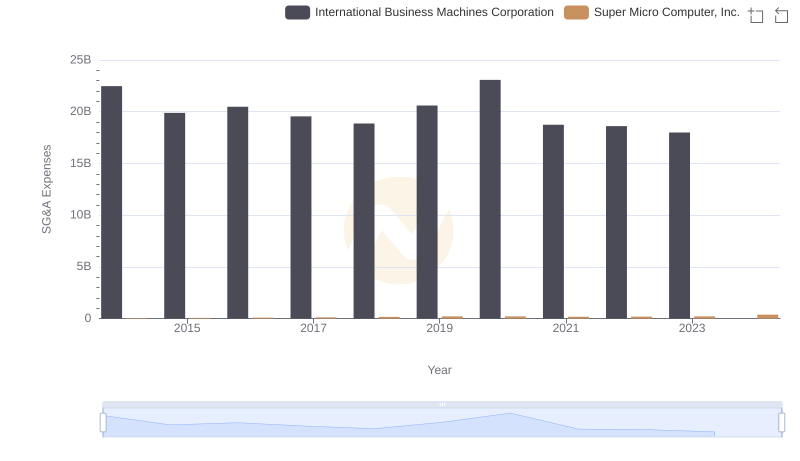
Selling, General, and Administrative Costs: International Business Machines Corporation vs Super Micro Computer, Inc.
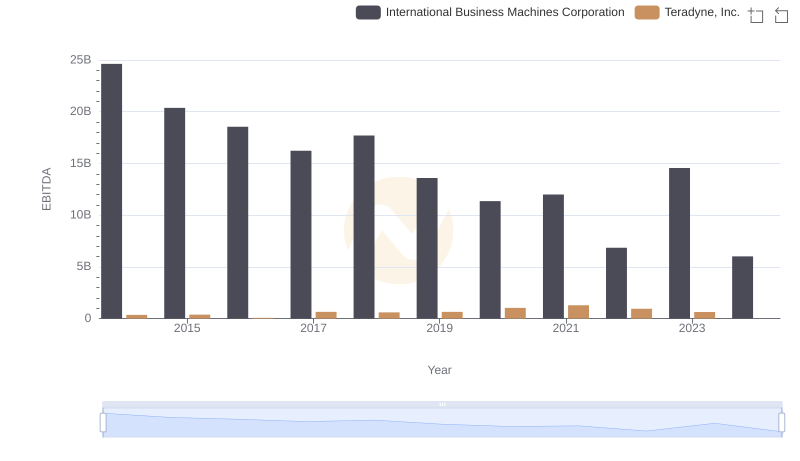
EBITDA Performance Review: International Business Machines Corporation vs Teradyne, Inc.
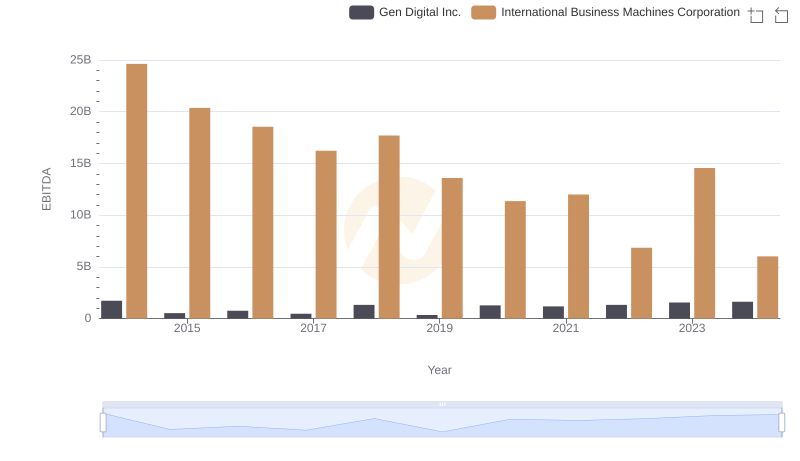
Comprehensive EBITDA Comparison: International Business Machines Corporation vs Gen Digital Inc.
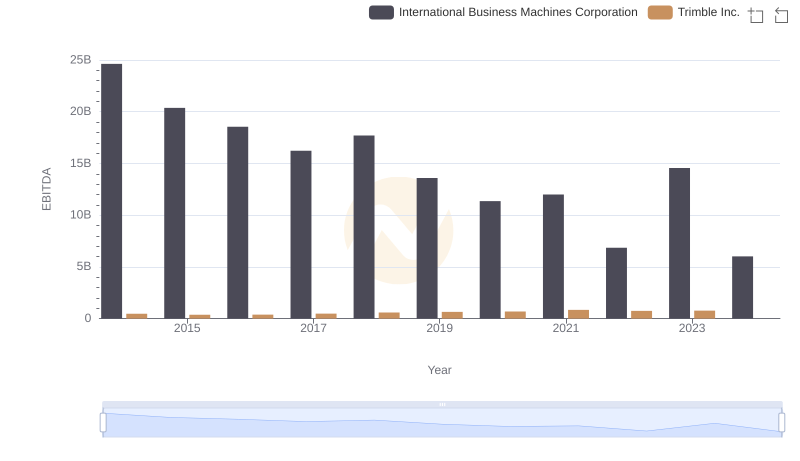
Comparative EBITDA Analysis: International Business Machines Corporation vs Trimble Inc.
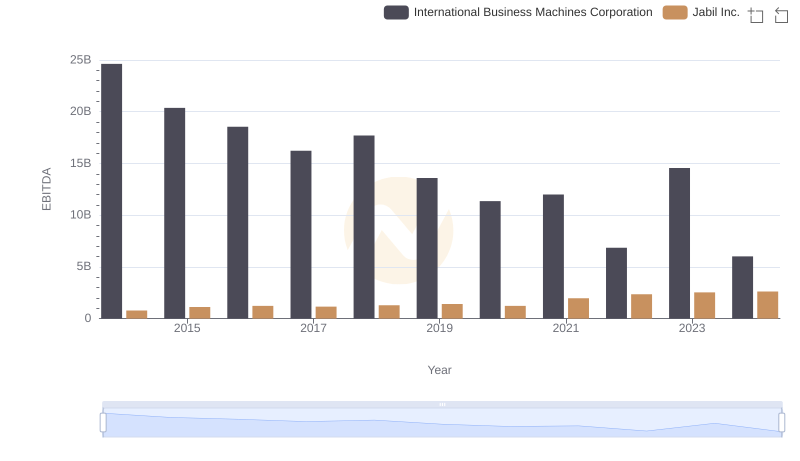
International Business Machines Corporation and Jabil Inc.: A Detailed Examination of EBITDA Performance
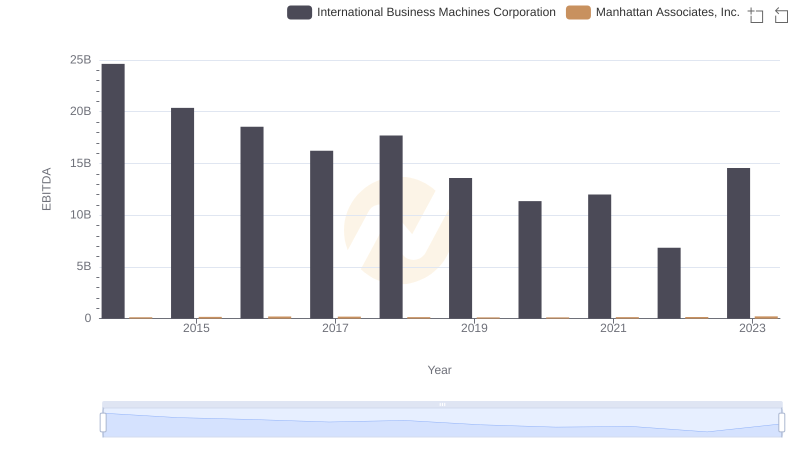
EBITDA Performance Review: International Business Machines Corporation vs Manhattan Associates, Inc.