| __timestamp | International Business Machines Corporation | Manhattan Associates, Inc. |
|---|---|---|
| Wednesday, January 1, 2014 | 92793000000 | 492104000 |
| Thursday, January 1, 2015 | 81742000000 | 556371000 |
| Friday, January 1, 2016 | 79920000000 | 604557000 |
| Sunday, January 1, 2017 | 79139000000 | 594599000 |
| Monday, January 1, 2018 | 79591000000 | 559157000 |
| Tuesday, January 1, 2019 | 57714000000 | 617949000 |
| Wednesday, January 1, 2020 | 55179000000 | 586372000 |
| Friday, January 1, 2021 | 57351000000 | 663643000 |
| Saturday, January 1, 2022 | 60530000000 | 767084000 |
| Sunday, January 1, 2023 | 61860000000 | 928725000 |
| Monday, January 1, 2024 | 62753000000 | 1042352000 |
In pursuit of knowledge
In the ever-evolving landscape of technology and business solutions, International Business Machines Corporation (IBM) and Manhattan Associates, Inc. stand as titans with distinct trajectories. Over the past decade, IBM's annual revenue has seen a decline of approximately 32%, from its peak in 2014 to 2024. This trend reflects the challenges faced by traditional tech giants in adapting to the rapidly changing digital era.
Conversely, Manhattan Associates, a leader in supply chain and omnichannel commerce, has experienced a remarkable growth of over 110% in the same period. This surge underscores the increasing demand for innovative supply chain solutions in a globalized market. As we look to the future, the contrasting paths of these companies highlight the dynamic nature of the tech industry and the importance of agility and innovation.
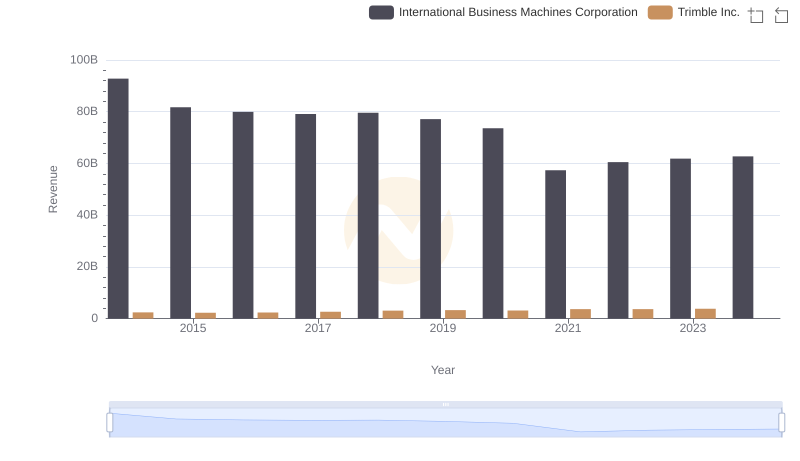
International Business Machines Corporation or Trimble Inc.: Who Leads in Yearly Revenue?
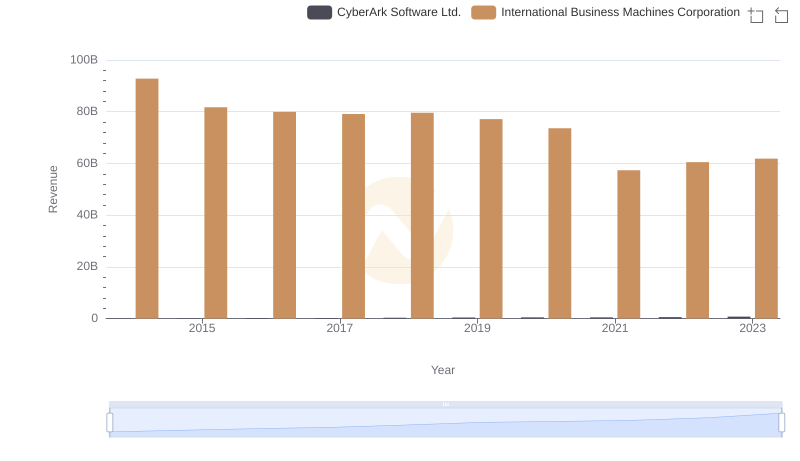
International Business Machines Corporation or CyberArk Software Ltd.: Who Leads in Yearly Revenue?
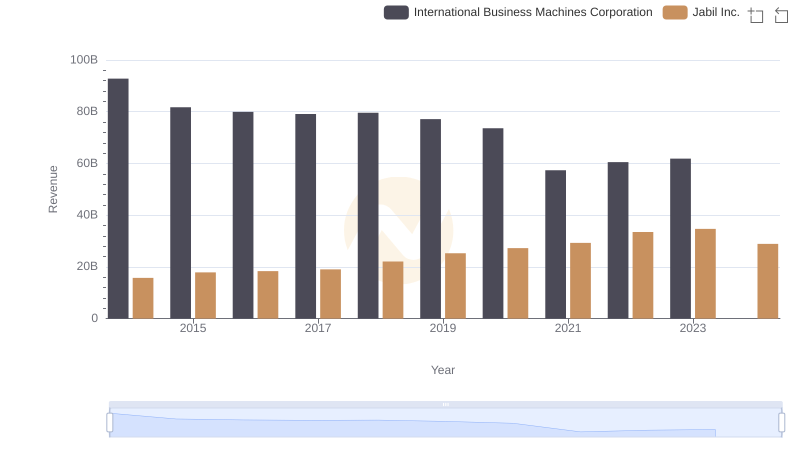
International Business Machines Corporation vs Jabil Inc.: Examining Key Revenue Metrics
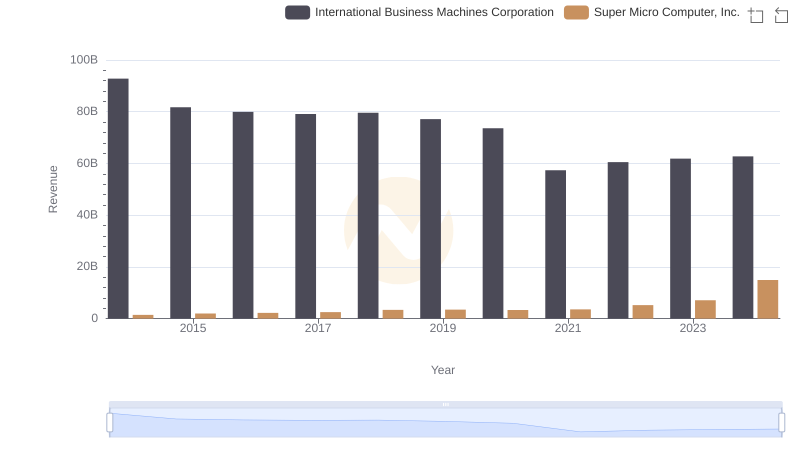
International Business Machines Corporation or Super Micro Computer, Inc.: Who Leads in Yearly Revenue?
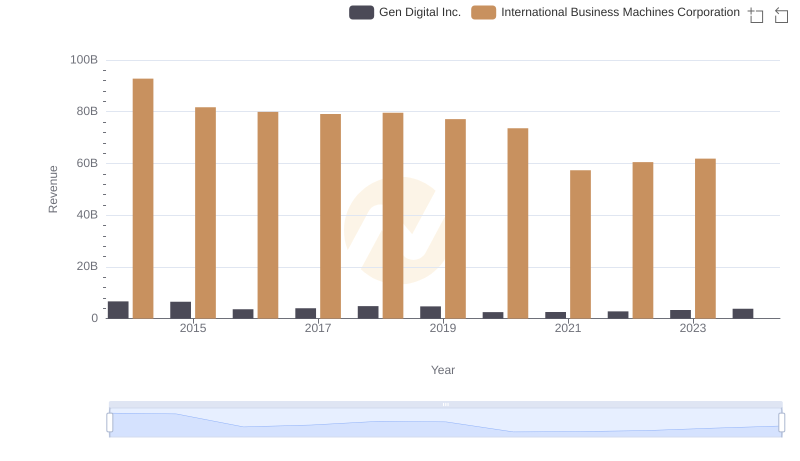
Revenue Insights: International Business Machines Corporation and Gen Digital Inc. Performance Compared
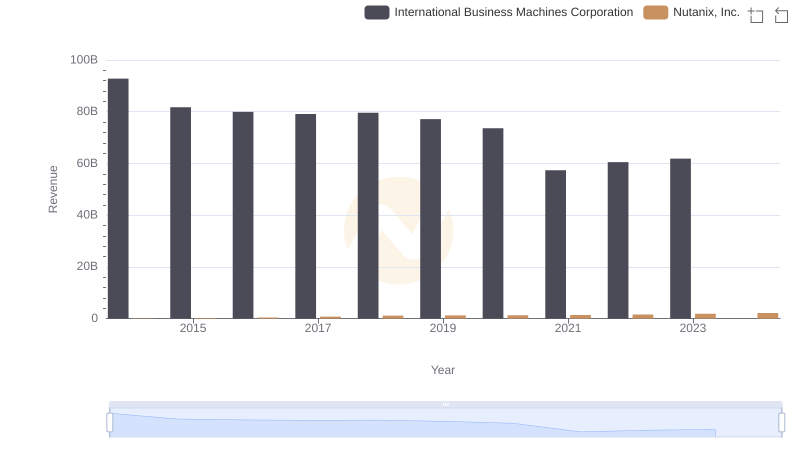
Comparing Revenue Performance: International Business Machines Corporation or Nutanix, Inc.?
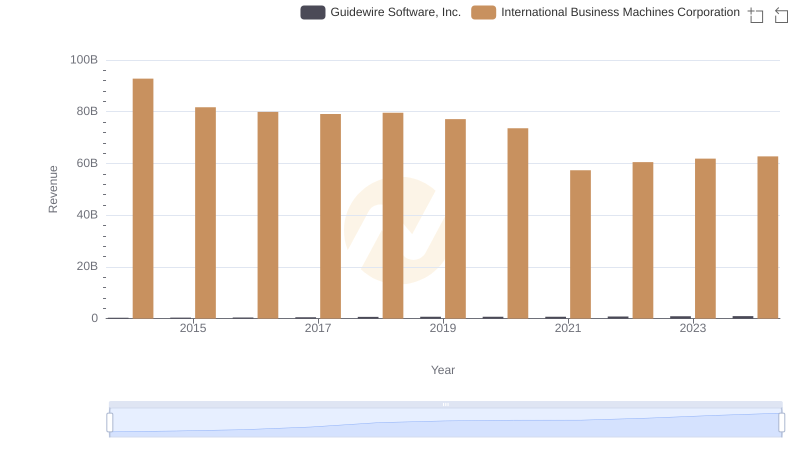
International Business Machines Corporation or Guidewire Software, Inc.: Who Leads in Yearly Revenue?
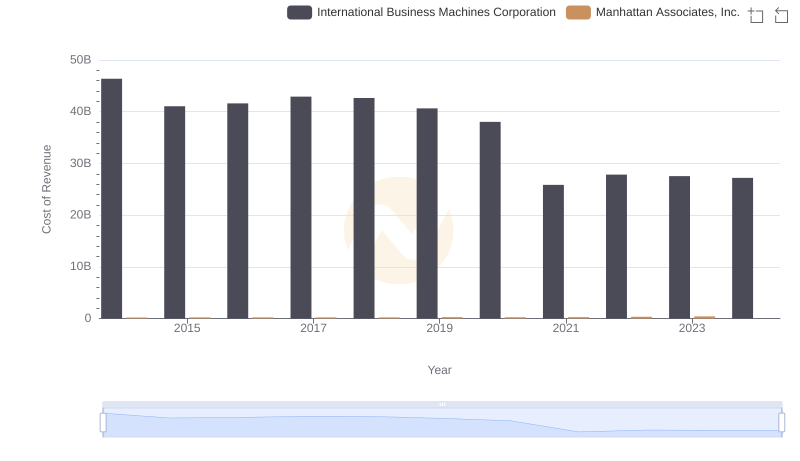
Comparing Cost of Revenue Efficiency: International Business Machines Corporation vs Manhattan Associates, Inc.
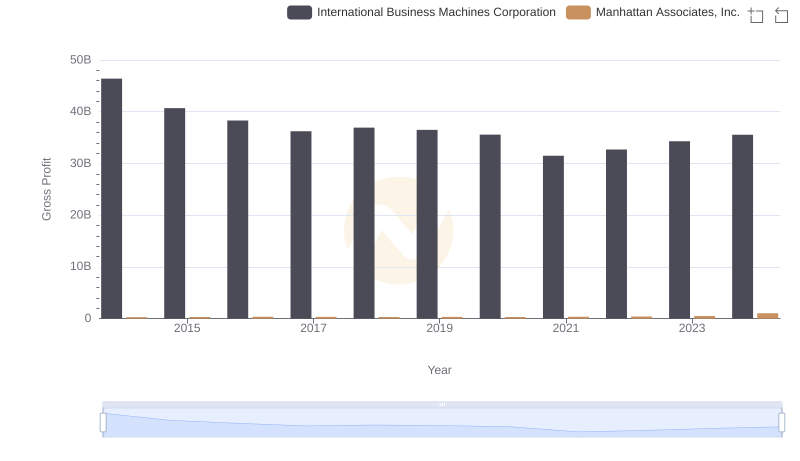
International Business Machines Corporation and Manhattan Associates, Inc.: A Detailed Gross Profit Analysis
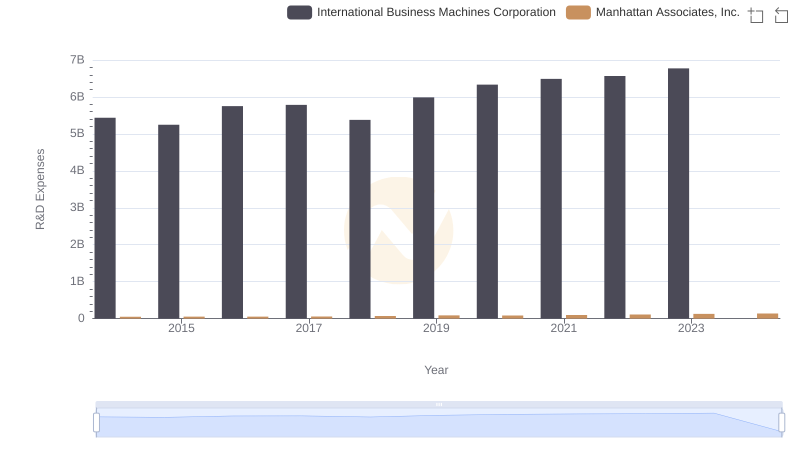
Research and Development: Comparing Key Metrics for International Business Machines Corporation and Manhattan Associates, Inc.
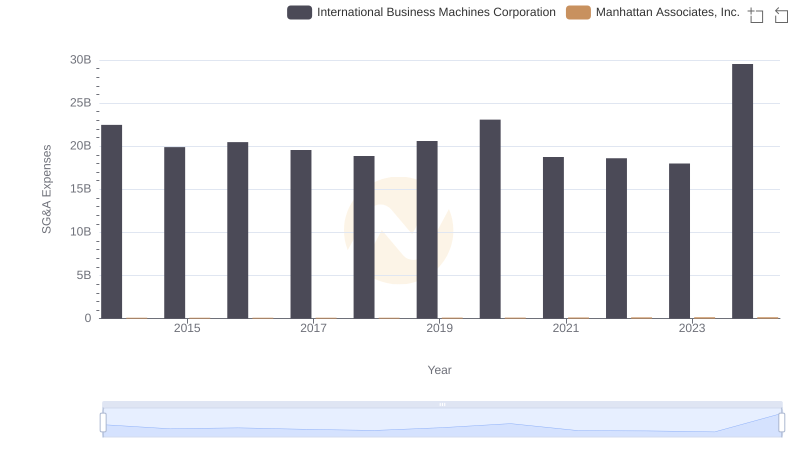
Selling, General, and Administrative Costs: International Business Machines Corporation vs Manhattan Associates, Inc.
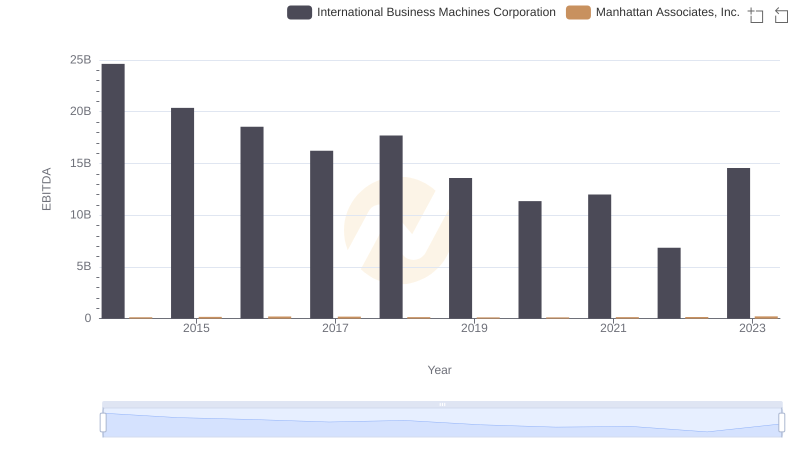
EBITDA Performance Review: International Business Machines Corporation vs Manhattan Associates, Inc.