| __timestamp | International Business Machines Corporation | Manhattan Associates, Inc. |
|---|---|---|
| Wednesday, January 1, 2014 | 22472000000 | 97072000 |
| Thursday, January 1, 2015 | 19894000000 | 97874000 |
| Friday, January 1, 2016 | 20279000000 | 96545000 |
| Sunday, January 1, 2017 | 19680000000 | 93536000 |
| Monday, January 1, 2018 | 19366000000 | 103880000 |
| Tuesday, January 1, 2019 | 18724000000 | 121463000 |
| Wednesday, January 1, 2020 | 20561000000 | 109202000 |
| Friday, January 1, 2021 | 18745000000 | 125941000 |
| Saturday, January 1, 2022 | 17483000000 | 137607000 |
| Sunday, January 1, 2023 | 17997000000 | 155664000 |
| Monday, January 1, 2024 | 29536000000 | 165786000 |
Infusing magic into the data realm
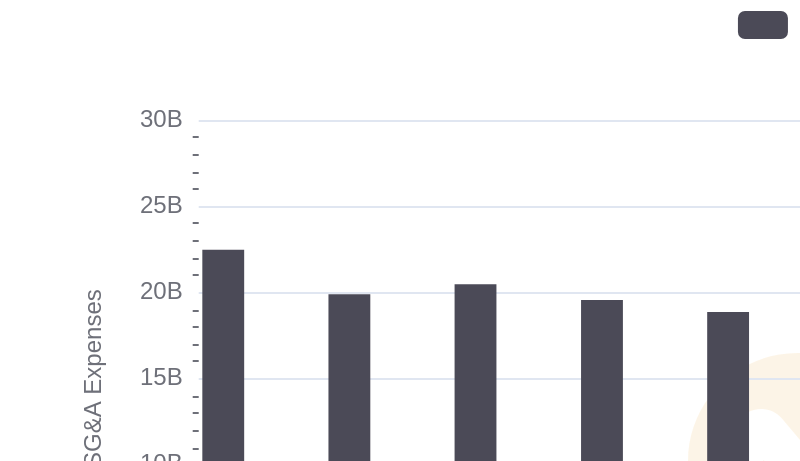
In the ever-evolving landscape of corporate finance, understanding the nuances of Selling, General, and Administrative (SG&A) expenses is crucial. Over the past decade, International Business Machines Corporation (IBM) and Manhattan Associates, Inc. have showcased contrasting financial strategies. IBM, a titan in the tech industry, has consistently reported SG&A expenses averaging around $20 billion annually, peaking at $29.5 billion in 2024. This represents a significant 48% increase from its lowest point in 2023. In contrast, Manhattan Associates, a leader in supply chain solutions, maintains a leaner approach with expenses averaging $118 million, marking a steady growth of 71% from 2014 to 2024. This divergence highlights IBM's expansive operational scale compared to Manhattan's focused efficiency. As businesses navigate the complexities of the modern economy, these insights offer a window into strategic financial management.
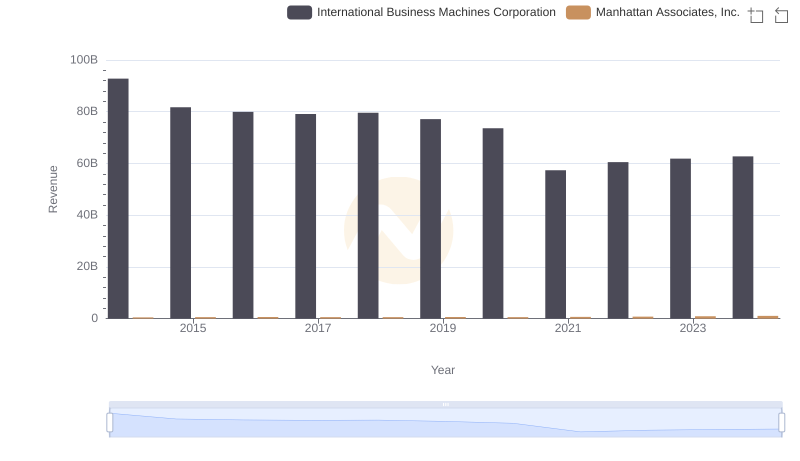
International Business Machines Corporation vs Manhattan Associates, Inc.: Annual Revenue Growth Compared
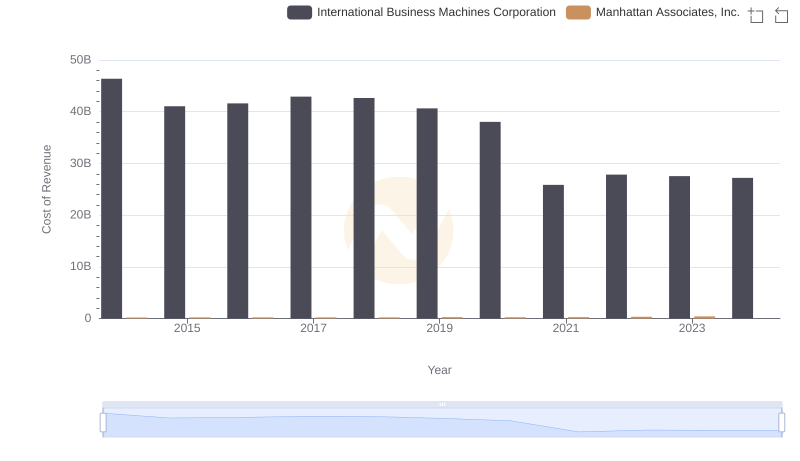
Comparing Cost of Revenue Efficiency: International Business Machines Corporation vs Manhattan Associates, Inc.
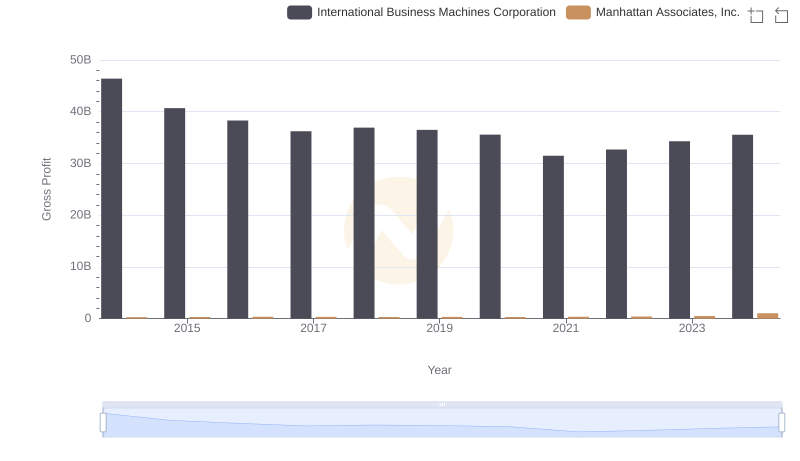
International Business Machines Corporation and Manhattan Associates, Inc.: A Detailed Gross Profit Analysis
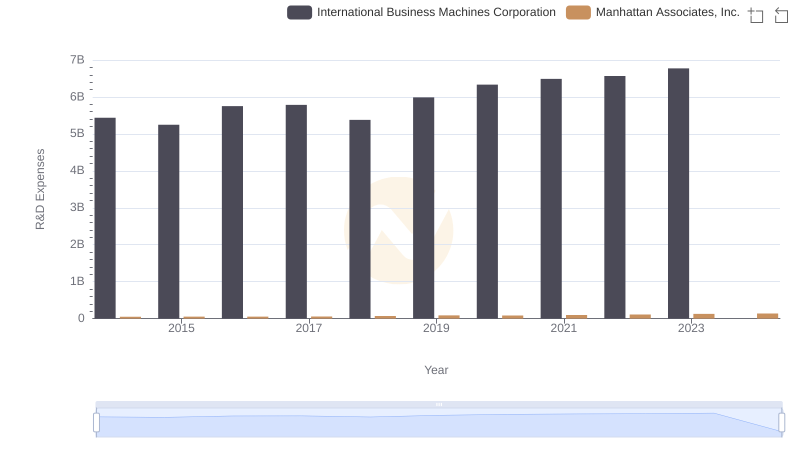
Research and Development: Comparing Key Metrics for International Business Machines Corporation and Manhattan Associates, Inc.
Breaking Down SG&A Expenses: International Business Machines Corporation vs Trimble Inc.
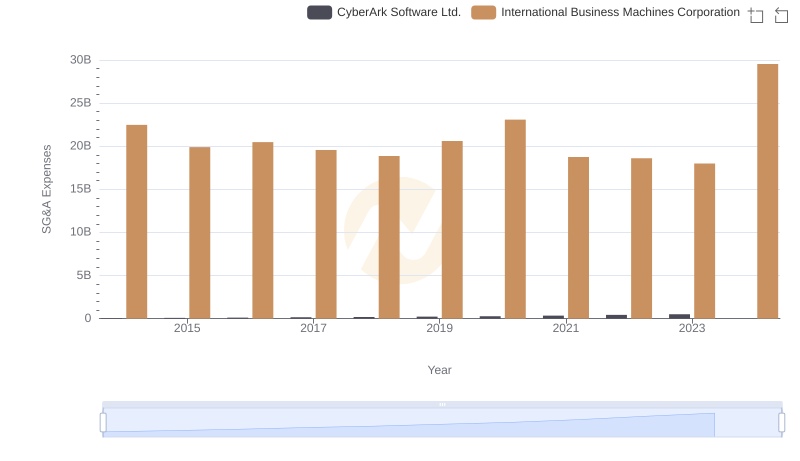
International Business Machines Corporation or CyberArk Software Ltd.: Who Manages SG&A Costs Better?
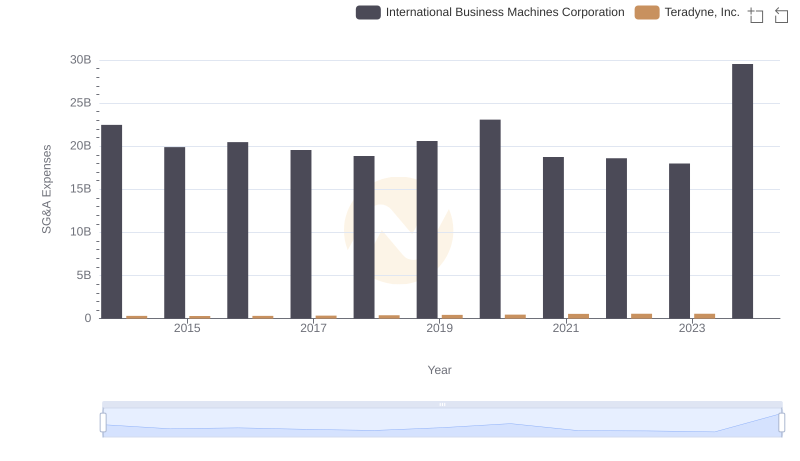
Selling, General, and Administrative Costs: International Business Machines Corporation vs Teradyne, Inc.
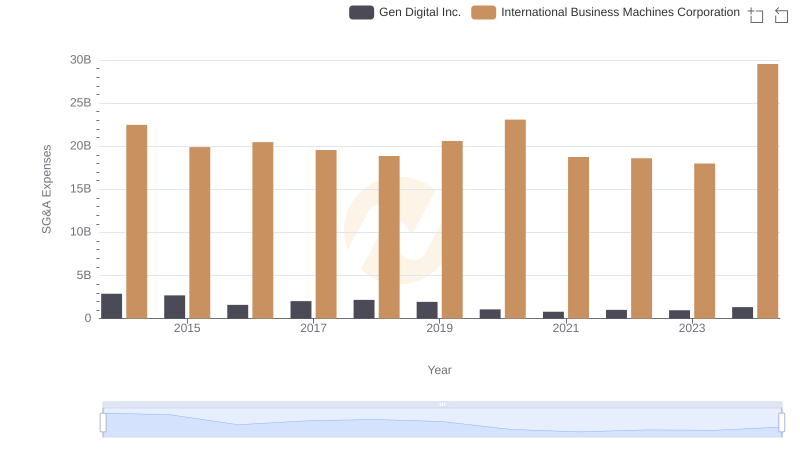
Selling, General, and Administrative Costs: International Business Machines Corporation vs Gen Digital Inc.
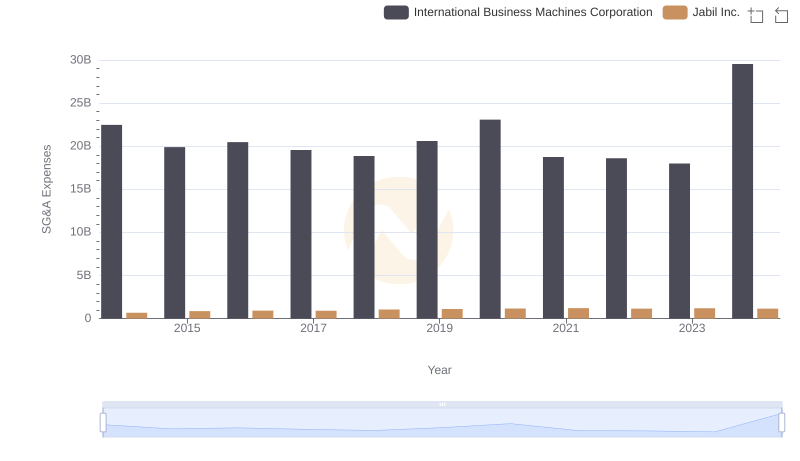
Selling, General, and Administrative Costs: International Business Machines Corporation vs Jabil Inc.
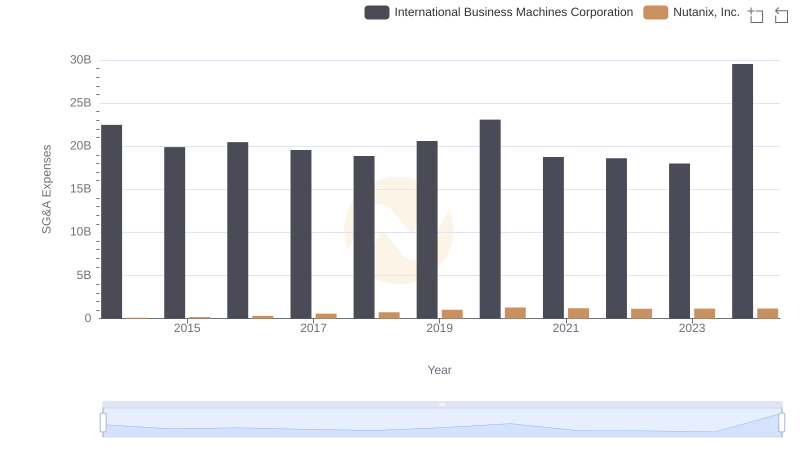
International Business Machines Corporation and Nutanix, Inc.: SG&A Spending Patterns Compared
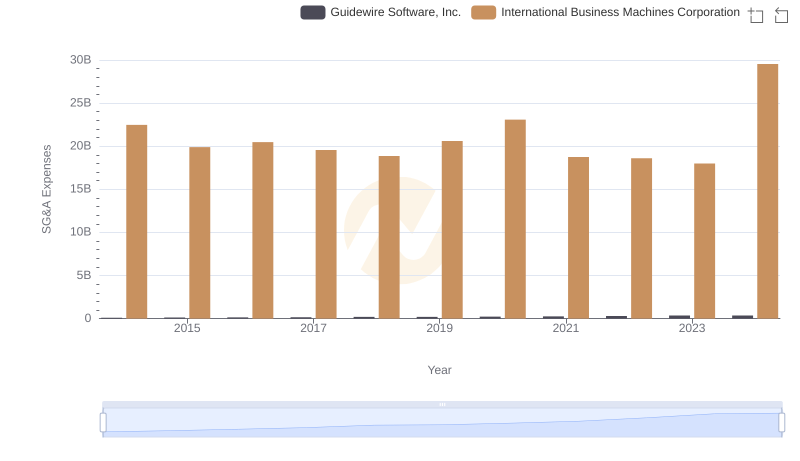
Breaking Down SG&A Expenses: International Business Machines Corporation vs Guidewire Software, Inc.
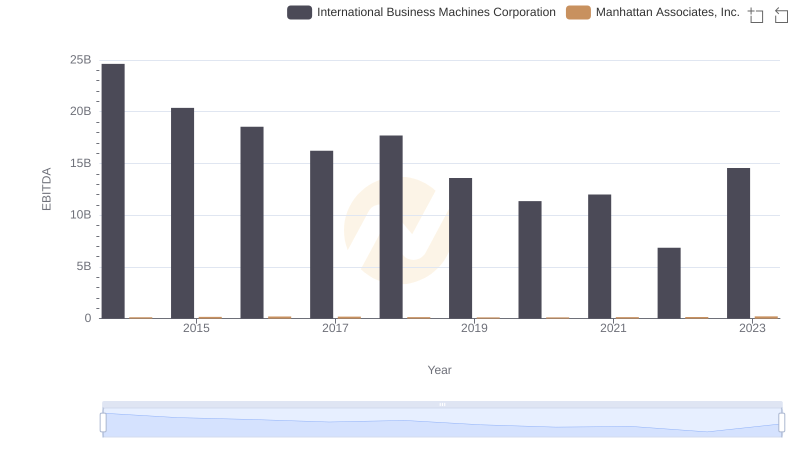
EBITDA Performance Review: International Business Machines Corporation vs Manhattan Associates, Inc.