| __timestamp | International Business Machines Corporation | STMicroelectronics N.V. |
|---|---|---|
| Wednesday, January 1, 2014 | 24962000000 | 1069000000 |
| Thursday, January 1, 2015 | 20268000000 | 887000000 |
| Friday, January 1, 2016 | 17341000000 | 1001000000 |
| Sunday, January 1, 2017 | 16556000000 | 1655000000 |
| Monday, January 1, 2018 | 16545000000 | 2197000000 |
| Tuesday, January 1, 2019 | 14609000000 | 2040000000 |
| Wednesday, January 1, 2020 | 10555000000 | 2266000000 |
| Friday, January 1, 2021 | 12409000000 | 3611000000 |
| Saturday, January 1, 2022 | 7174000000 | 6397000000 |
| Sunday, January 1, 2023 | 14693000000 | 6379000000 |
| Monday, January 1, 2024 | 6015000000 |
Igniting the spark of knowledge
In the ever-evolving landscape of technology giants, International Business Machines Corporation (IBM) and STMicroelectronics N.V. (STM) have been pivotal players. Over the past decade, IBM's EBITDA has seen a significant decline, dropping from a peak of approximately $24.6 billion in 2014 to around $6 billion in 2024. This represents a staggering 76% decrease, highlighting the challenges faced by the company in adapting to the rapidly changing tech environment.
Conversely, STM has shown remarkable growth, with its EBITDA increasing by nearly 500% from 2014 to 2023, reaching approximately $6.4 billion. This growth trajectory underscores STM's strategic positioning in the semiconductor industry, capitalizing on the surge in demand for microelectronics.
While IBM's journey reflects a need for reinvention, STM's rise showcases the potential of agile adaptation in the tech sector. Missing data for 2024 suggests ongoing developments worth monitoring.
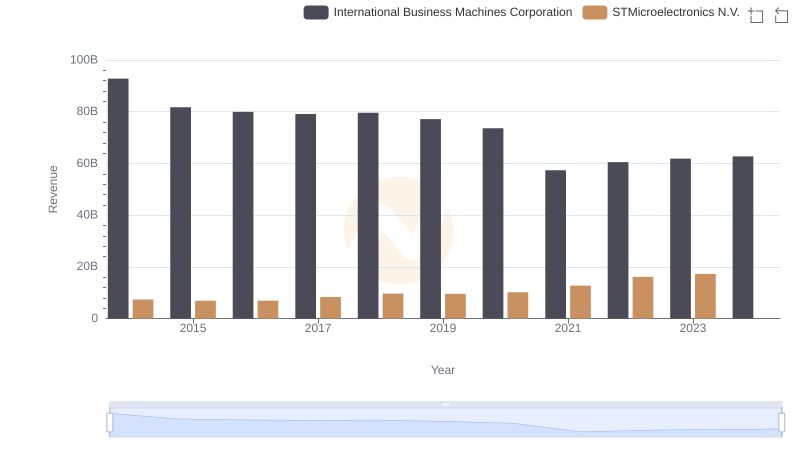
Who Generates More Revenue? International Business Machines Corporation or STMicroelectronics N.V.
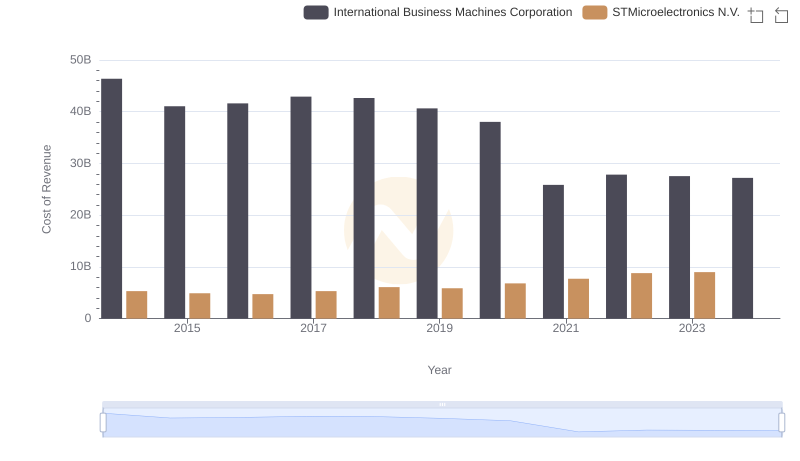
Cost of Revenue Comparison: International Business Machines Corporation vs STMicroelectronics N.V.
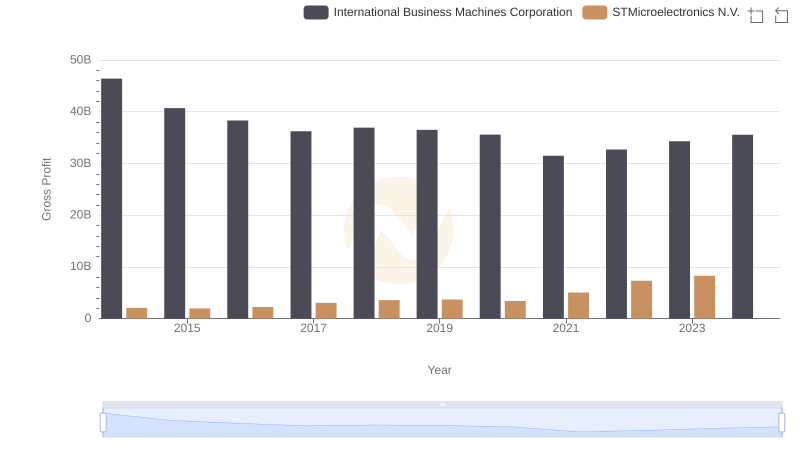
Who Generates Higher Gross Profit? International Business Machines Corporation or STMicroelectronics N.V.
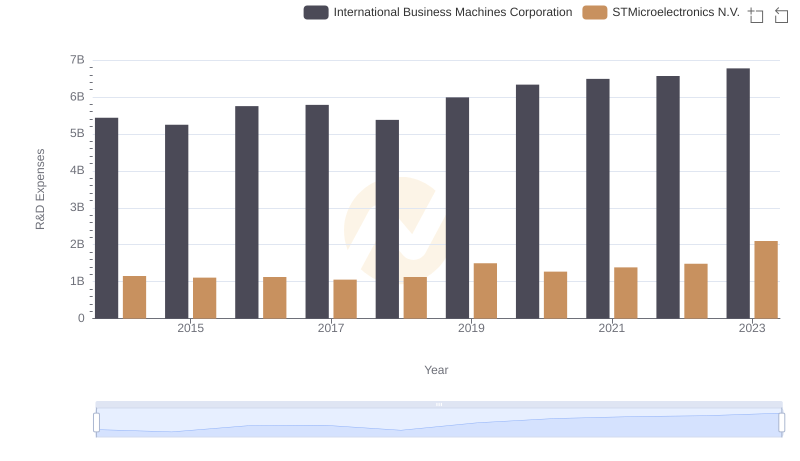
R&D Spending Showdown: International Business Machines Corporation vs STMicroelectronics N.V.
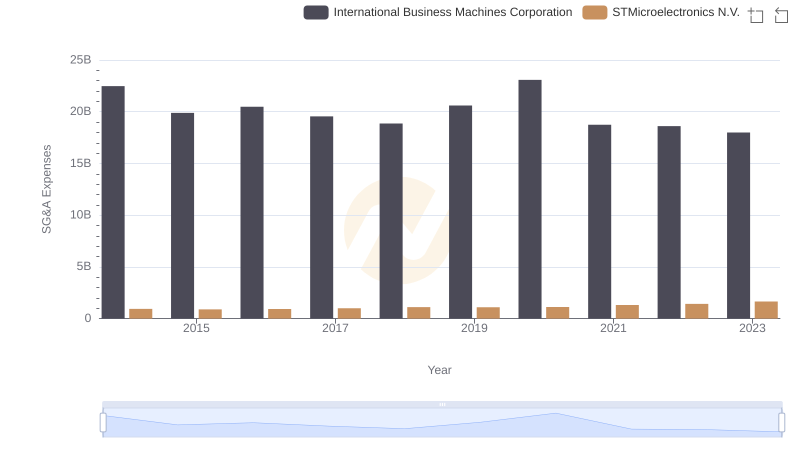
International Business Machines Corporation or STMicroelectronics N.V.: Who Manages SG&A Costs Better?
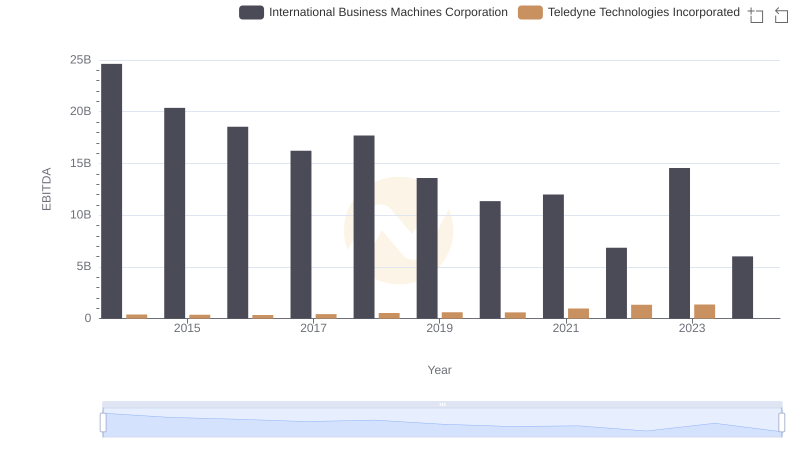
A Professional Review of EBITDA: International Business Machines Corporation Compared to Teledyne Technologies Incorporated

EBITDA Analysis: Evaluating International Business Machines Corporation Against PTC Inc.
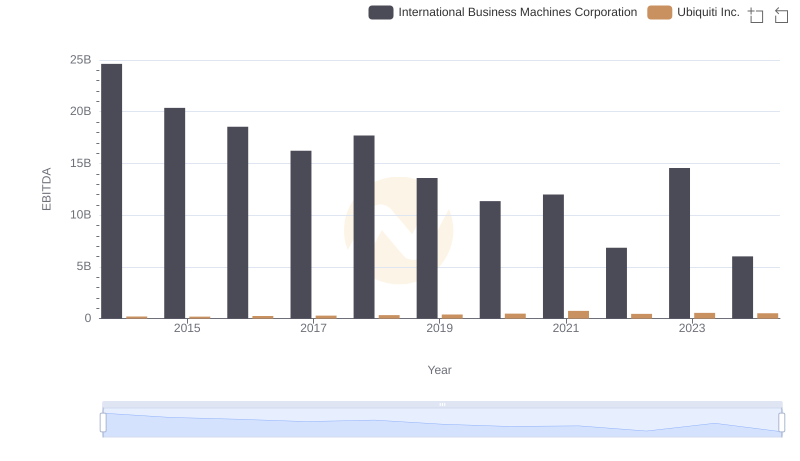
EBITDA Analysis: Evaluating International Business Machines Corporation Against Ubiquiti Inc.
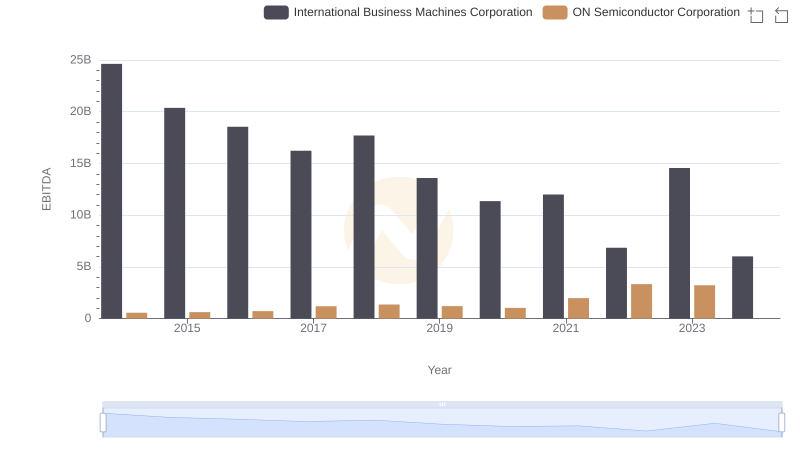
EBITDA Analysis: Evaluating International Business Machines Corporation Against ON Semiconductor Corporation
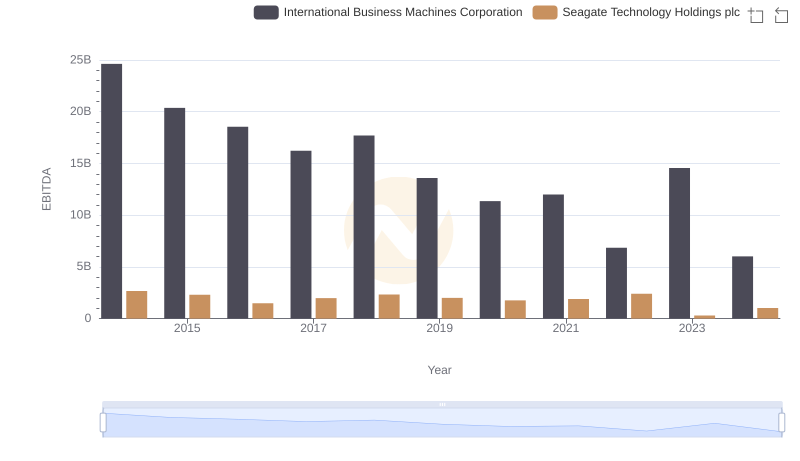
International Business Machines Corporation vs Seagate Technology Holdings plc: In-Depth EBITDA Performance Comparison

International Business Machines Corporation vs FLEETCOR Technologies, Inc.: In-Depth EBITDA Performance Comparison
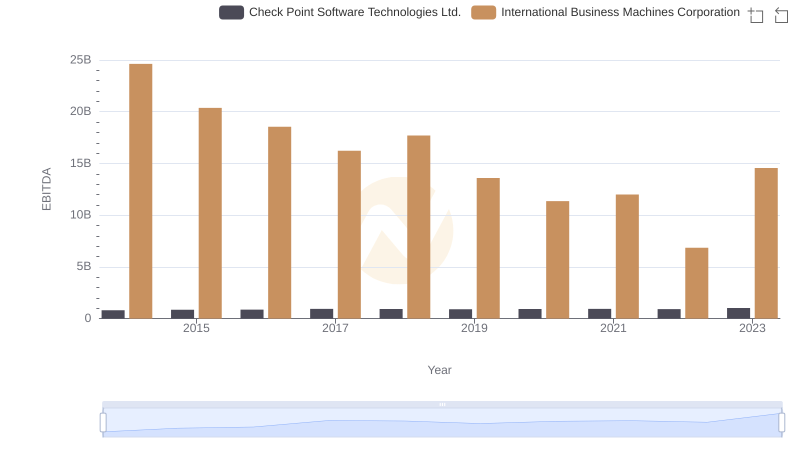
International Business Machines Corporation and Check Point Software Technologies Ltd.: A Detailed Examination of EBITDA Performance