| __timestamp | FLEETCOR Technologies, Inc. | International Business Machines Corporation |
|---|---|---|
| Wednesday, January 1, 2014 | 669924000 | 24962000000 |
| Thursday, January 1, 2015 | 800796000 | 20268000000 |
| Friday, January 1, 2016 | 918071000 | 17341000000 |
| Sunday, January 1, 2017 | 1321756000 | 16556000000 |
| Monday, January 1, 2018 | 1517473000 | 16545000000 |
| Tuesday, January 1, 2019 | 1505547000 | 14609000000 |
| Wednesday, January 1, 2020 | 1237122000 | 10555000000 |
| Friday, January 1, 2021 | 1522895000 | 12409000000 |
| Saturday, January 1, 2022 | 1765920000 | 7174000000 |
| Sunday, January 1, 2023 | 2027494000 | 14693000000 |
| Monday, January 1, 2024 | 2119258000 | 6015000000 |
In pursuit of knowledge
In the ever-evolving landscape of global business, the financial performance of industry leaders like International Business Machines Corporation (IBM) and FLEETCOR Technologies, Inc. offers a fascinating glimpse into their strategic maneuvers. Over the past decade, IBM's EBITDA has seen a significant decline, dropping from its peak in 2014 to nearly 60% less by 2022. This trend reflects IBM's ongoing transformation efforts and challenges in adapting to the digital age.
Conversely, FLEETCOR has demonstrated a robust upward trajectory, with its EBITDA more than doubling from 2014 to 2023. This growth underscores FLEETCOR's strategic expansion and operational efficiency in the financial technology sector. However, the data for 2024 remains incomplete, leaving room for speculation on future trends. As these two giants continue to navigate their respective markets, their financial narratives provide valuable insights into the broader economic landscape.
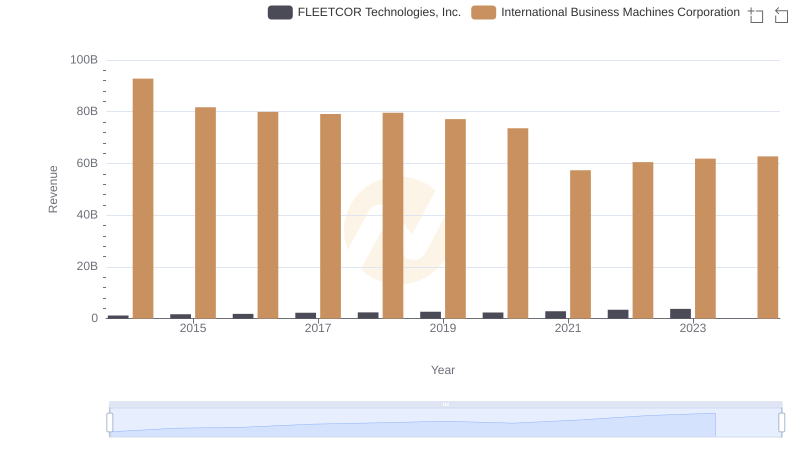
International Business Machines Corporation vs FLEETCOR Technologies, Inc.: Examining Key Revenue Metrics
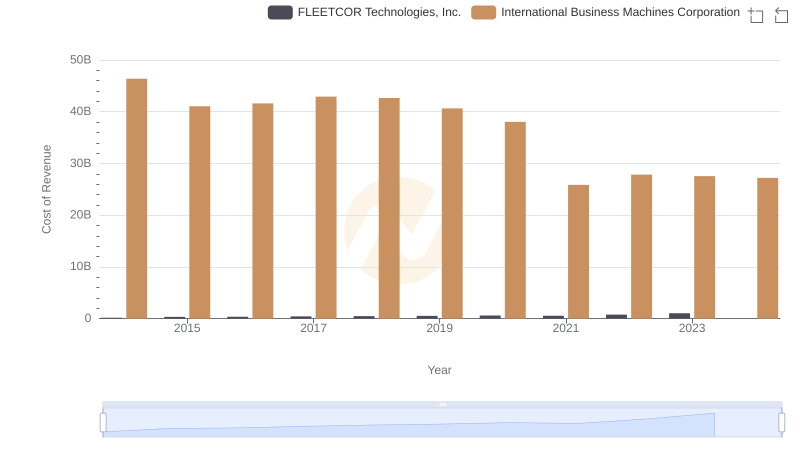
Analyzing Cost of Revenue: International Business Machines Corporation and FLEETCOR Technologies, Inc.
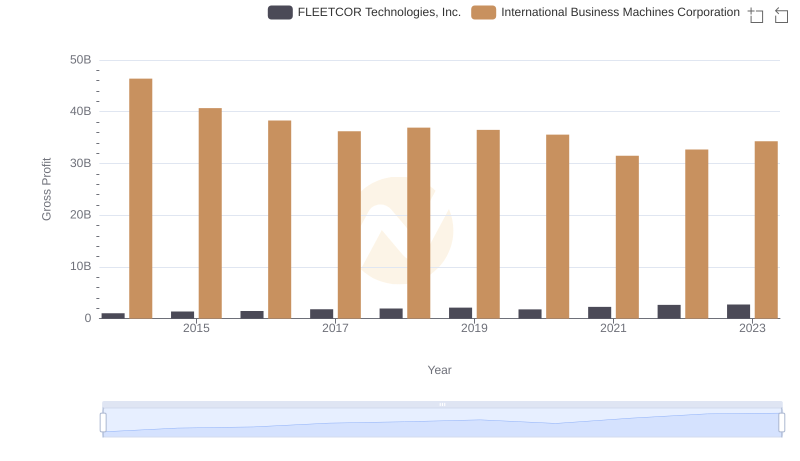
Gross Profit Comparison: International Business Machines Corporation and FLEETCOR Technologies, Inc. Trends
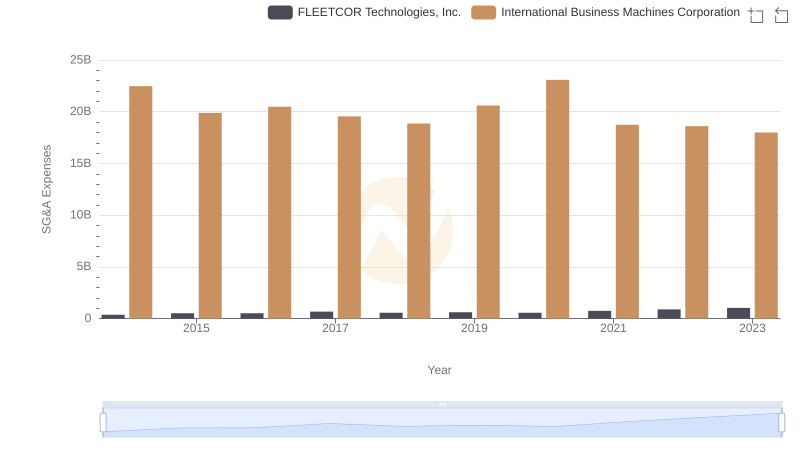
International Business Machines Corporation vs FLEETCOR Technologies, Inc.: SG&A Expense Trends
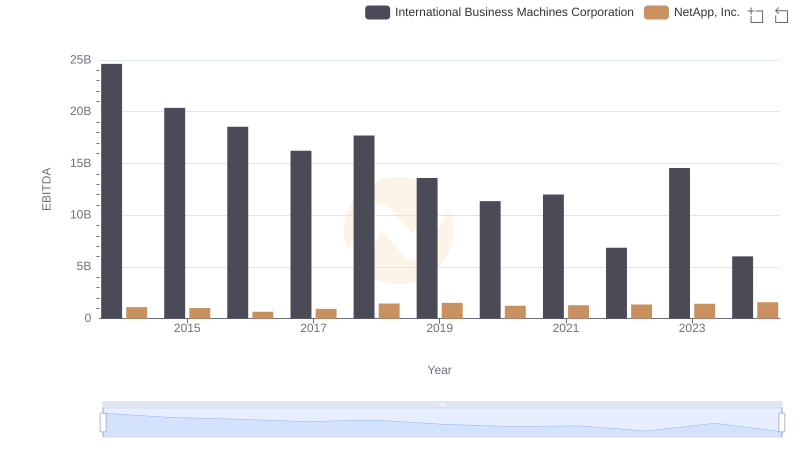
EBITDA Performance Review: International Business Machines Corporation vs NetApp, Inc.
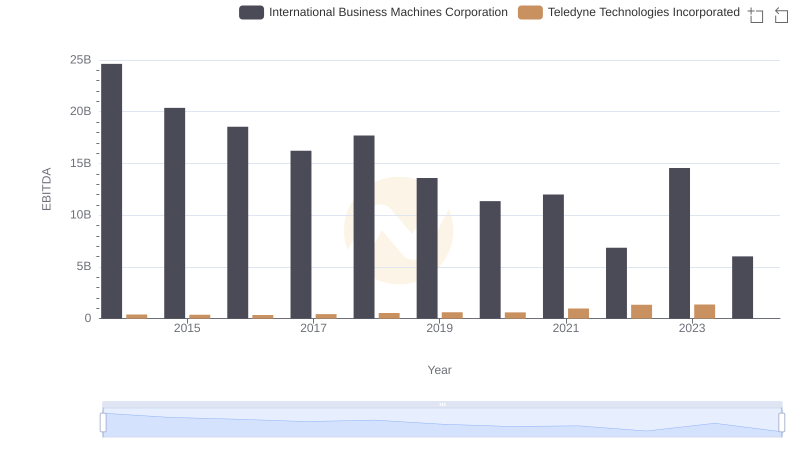
A Professional Review of EBITDA: International Business Machines Corporation Compared to Teledyne Technologies Incorporated

EBITDA Analysis: Evaluating International Business Machines Corporation Against PTC Inc.
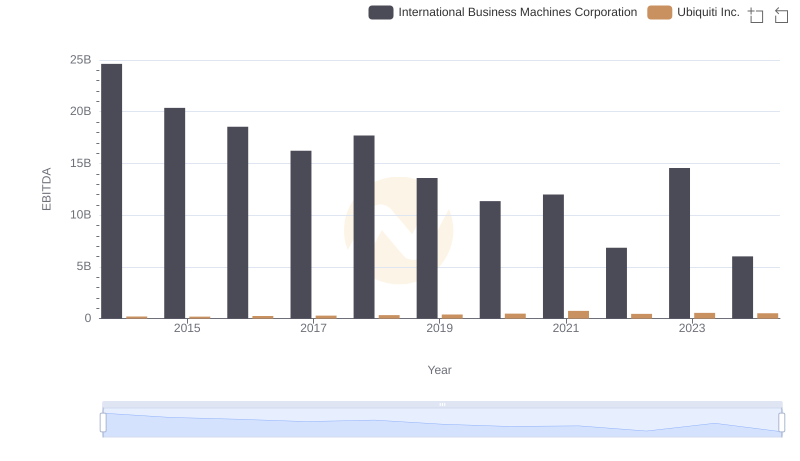
EBITDA Analysis: Evaluating International Business Machines Corporation Against Ubiquiti Inc.
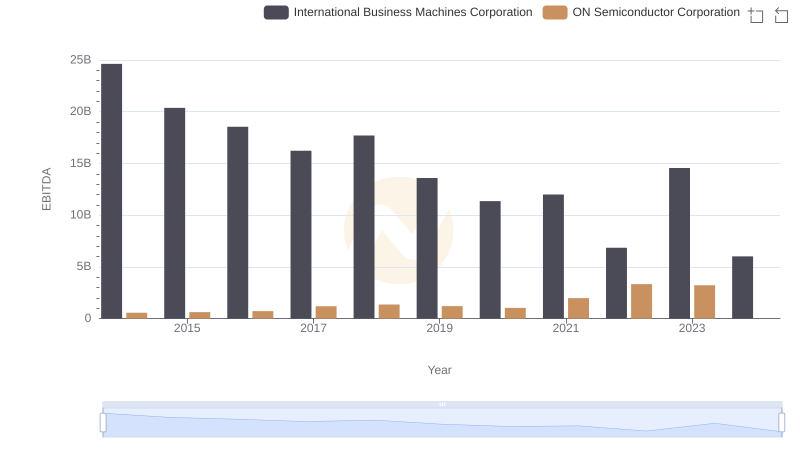
EBITDA Analysis: Evaluating International Business Machines Corporation Against ON Semiconductor Corporation
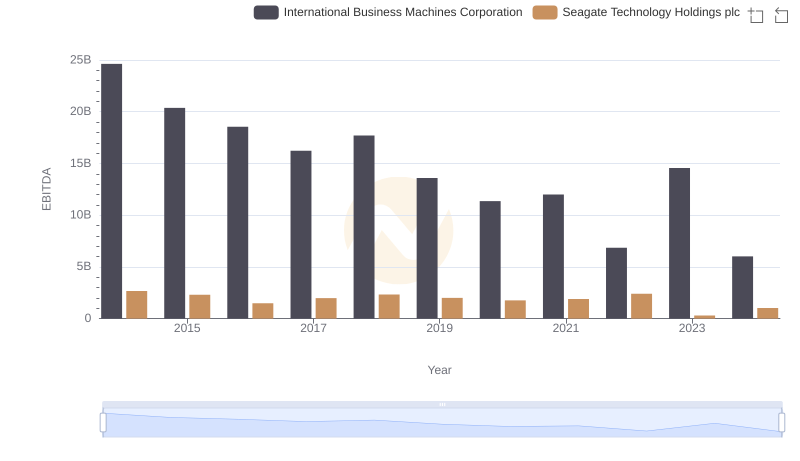
International Business Machines Corporation vs Seagate Technology Holdings plc: In-Depth EBITDA Performance Comparison
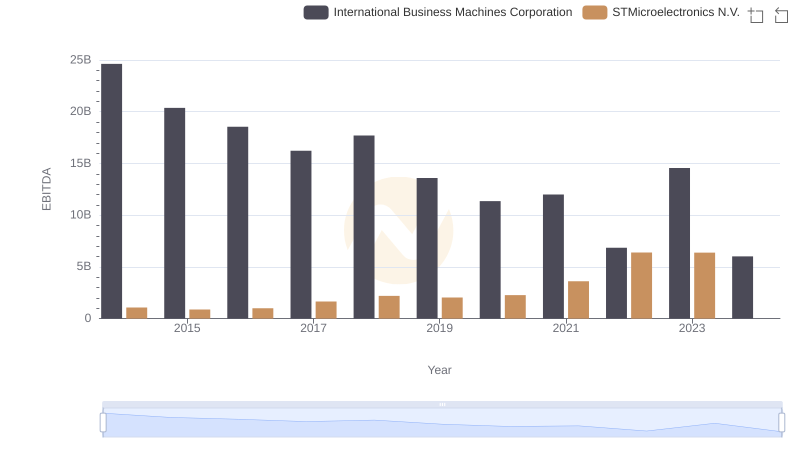
Professional EBITDA Benchmarking: International Business Machines Corporation vs STMicroelectronics N.V.
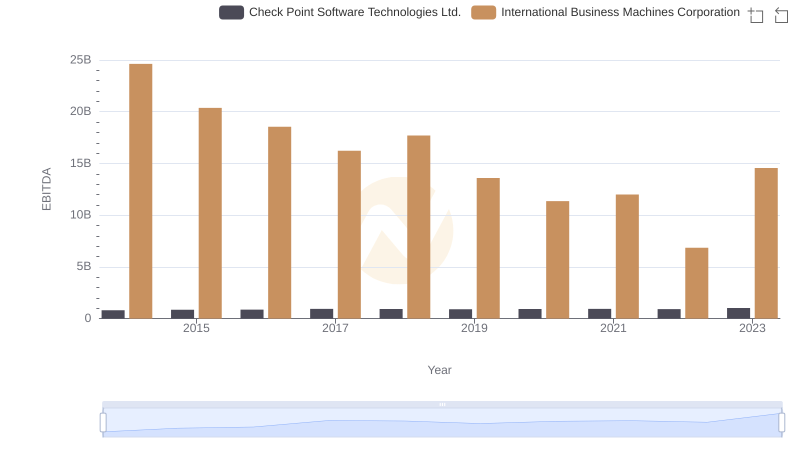
International Business Machines Corporation and Check Point Software Technologies Ltd.: A Detailed Examination of EBITDA Performance