| __timestamp | International Business Machines Corporation | SS&C Technologies Holdings, Inc. |
|---|---|---|
| Wednesday, January 1, 2014 | 24962000000 | 304662000 |
| Thursday, January 1, 2015 | 20268000000 | 291009000 |
| Friday, January 1, 2016 | 17341000000 | 522241000 |
| Sunday, January 1, 2017 | 16556000000 | 628500000 |
| Monday, January 1, 2018 | 16545000000 | 923700000 |
| Tuesday, January 1, 2019 | 14609000000 | 1716500000 |
| Wednesday, January 1, 2020 | 10555000000 | 1751000000 |
| Friday, January 1, 2021 | 12409000000 | 1910100000 |
| Saturday, January 1, 2022 | 7174000000 | 1859800000 |
| Sunday, January 1, 2023 | 14693000000 | 2004400000 |
| Monday, January 1, 2024 | 6015000000 | 1343500000 |
Unleashing insights
In the ever-evolving landscape of technology, the financial performance of industry leaders like International Business Machines Corporation (IBM) and SS&C Technologies Holdings, Inc. offers a fascinating glimpse into their strategic maneuvers. Over the past decade, IBM's EBITDA has seen a significant decline, dropping from a peak in 2014 to nearly half by 2024. This represents a dramatic shift, highlighting the challenges faced by traditional tech giants in adapting to new market dynamics.
Conversely, SS&C Technologies has shown a remarkable upward trajectory, with its EBITDA growing over six times from 2014 to 2023. This growth underscores the company's successful adaptation and expansion in the financial services software sector. The data for 2024 is incomplete, but the trends are clear: while IBM grapples with reinvention, SS&C Technologies continues to capitalize on its niche.
These insights provide a compelling narrative of transformation and resilience in the tech industry.

International Business Machines Corporation or SS&C Technologies Holdings, Inc.: Who Leads in Yearly Revenue?
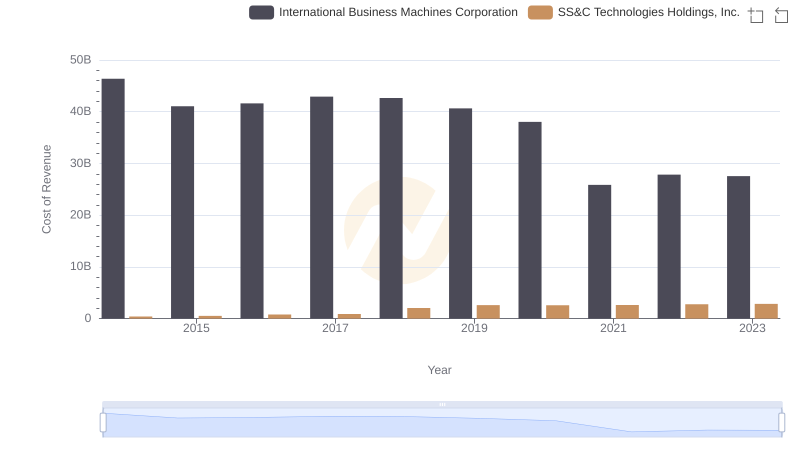
Analyzing Cost of Revenue: International Business Machines Corporation and SS&C Technologies Holdings, Inc.
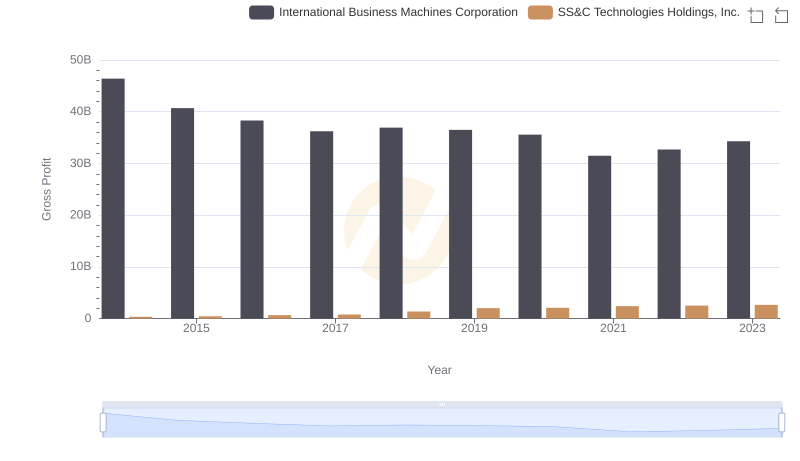
Who Generates Higher Gross Profit? International Business Machines Corporation or SS&C Technologies Holdings, Inc.
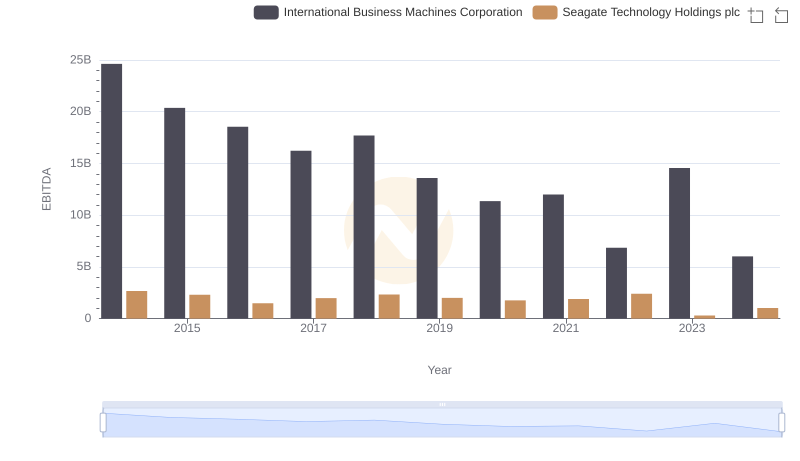
International Business Machines Corporation vs Seagate Technology Holdings plc: In-Depth EBITDA Performance Comparison
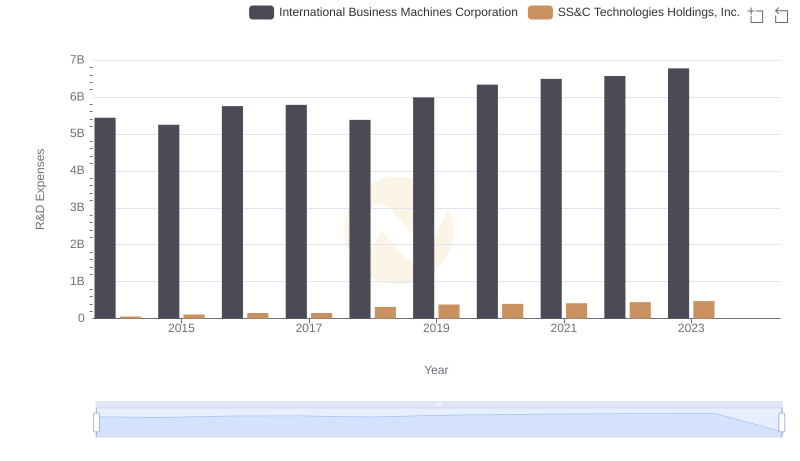
Comparing Innovation Spending: International Business Machines Corporation and SS&C Technologies Holdings, Inc.

International Business Machines Corporation vs FLEETCOR Technologies, Inc.: In-Depth EBITDA Performance Comparison
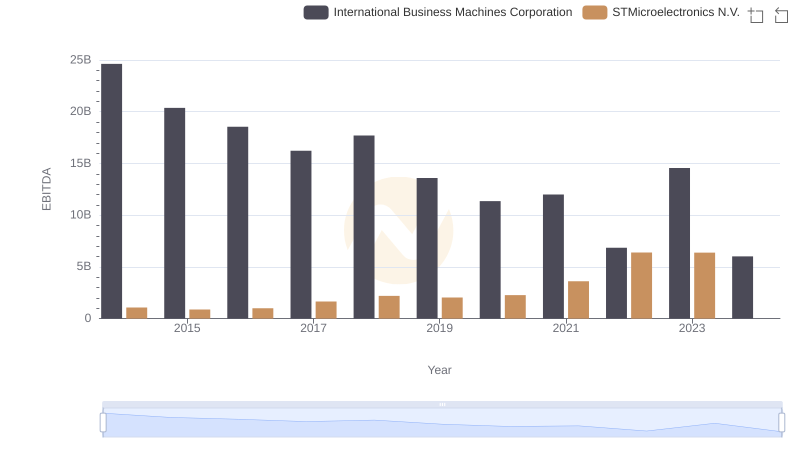
Professional EBITDA Benchmarking: International Business Machines Corporation vs STMicroelectronics N.V.
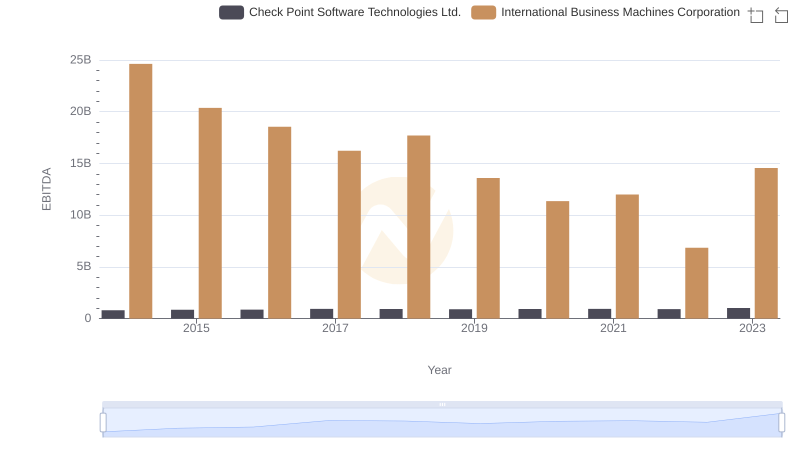
International Business Machines Corporation and Check Point Software Technologies Ltd.: A Detailed Examination of EBITDA Performance
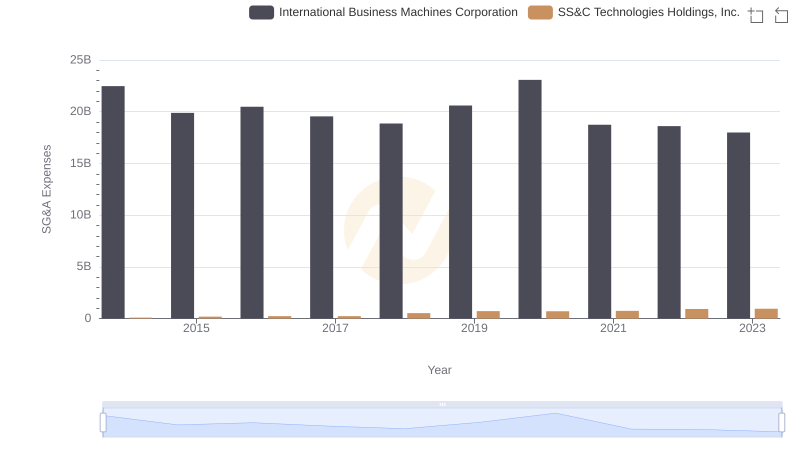
SG&A Efficiency Analysis: Comparing International Business Machines Corporation and SS&C Technologies Holdings, Inc.
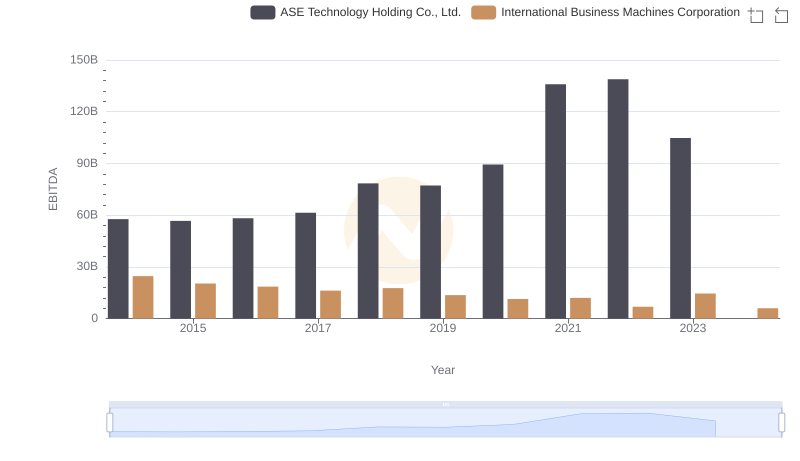
EBITDA Performance Review: International Business Machines Corporation vs ASE Technology Holding Co., Ltd.
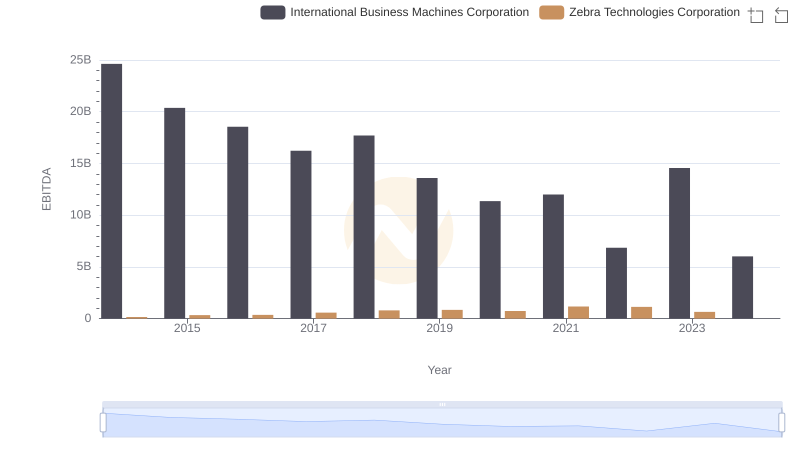
A Side-by-Side Analysis of EBITDA: International Business Machines Corporation and Zebra Technologies Corporation
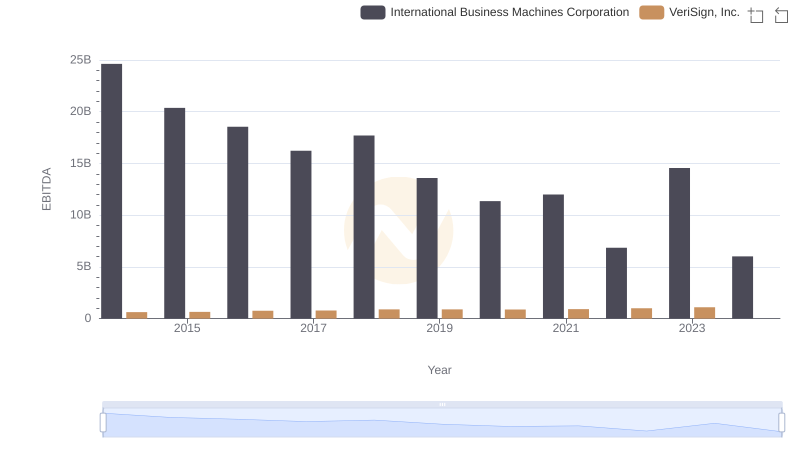
International Business Machines Corporation and VeriSign, Inc.: A Detailed Examination of EBITDA Performance