| __timestamp | Cintas Corporation | Roper Technologies, Inc. |
|---|---|---|
| Wednesday, January 1, 2014 | 793811000 | 1199557000 |
| Thursday, January 1, 2015 | 877761000 | 1238079000 |
| Friday, January 1, 2016 | 933728000 | 1290510000 |
| Sunday, January 1, 2017 | 968293000 | 1558802000 |
| Monday, January 1, 2018 | 1227852000 | 1746500000 |
| Tuesday, January 1, 2019 | 1564228000 | 2827900000 |
| Wednesday, January 1, 2020 | 1542737000 | 1782800000 |
| Friday, January 1, 2021 | 1773591000 | 1951500000 |
| Saturday, January 1, 2022 | 1990046000 | 2124500000 |
| Sunday, January 1, 2023 | 2221676000 | 2663000000 |
| Monday, January 1, 2024 | 2523857000 | 1996800000 |
Cracking the code
In the ever-evolving landscape of corporate finance, EBITDA serves as a crucial indicator of a company's operational efficiency. Over the past decade, Cintas Corporation and Roper Technologies, Inc. have demonstrated remarkable growth in this metric. Starting in 2014, Cintas reported an EBITDA of approximately $794 million, while Roper Technologies began at $1.2 billion. Fast forward to 2023, and Cintas has seen a staggering increase of over 180%, reaching $2.2 billion. Meanwhile, Roper Technologies has experienced a 122% growth, peaking at $2.7 billion in 2023. This comparison highlights Cintas's impressive upward trajectory, especially in recent years, despite Roper's higher initial figures. Notably, data for Roper Technologies in 2024 is missing, leaving room for speculation on its future performance. This analysis underscores the dynamic nature of these industry leaders and their strategic maneuvers in the competitive market.
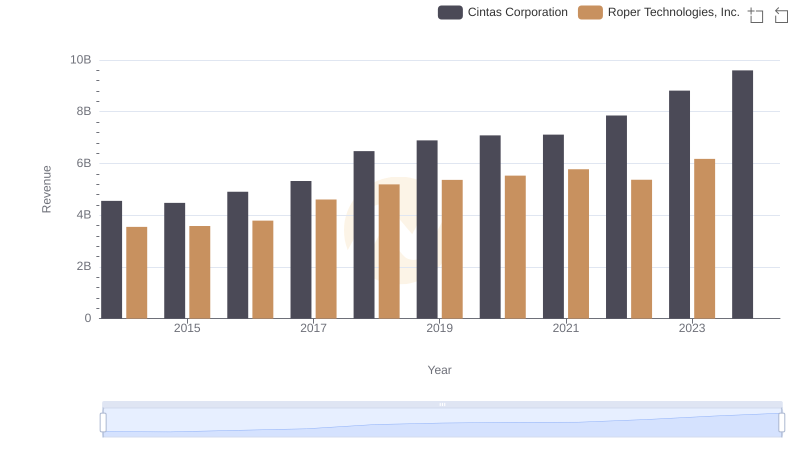
Comparing Revenue Performance: Cintas Corporation or Roper Technologies, Inc.?
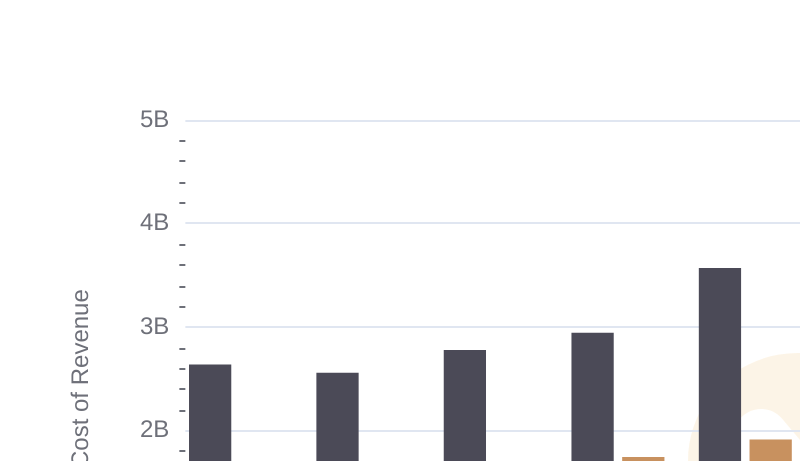
Cost of Revenue Comparison: Cintas Corporation vs Roper Technologies, Inc.
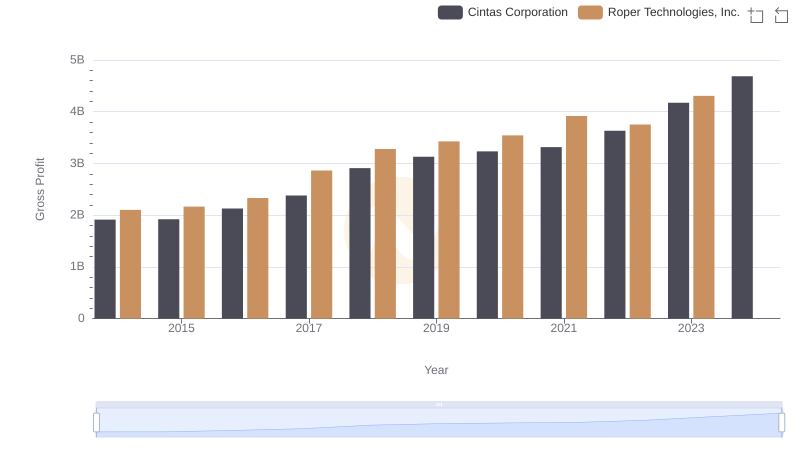
Key Insights on Gross Profit: Cintas Corporation vs Roper Technologies, Inc.
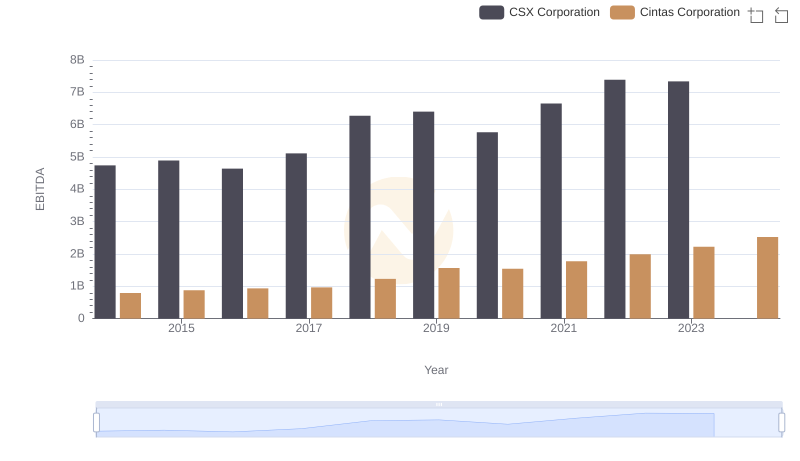
A Side-by-Side Analysis of EBITDA: Cintas Corporation and CSX Corporation
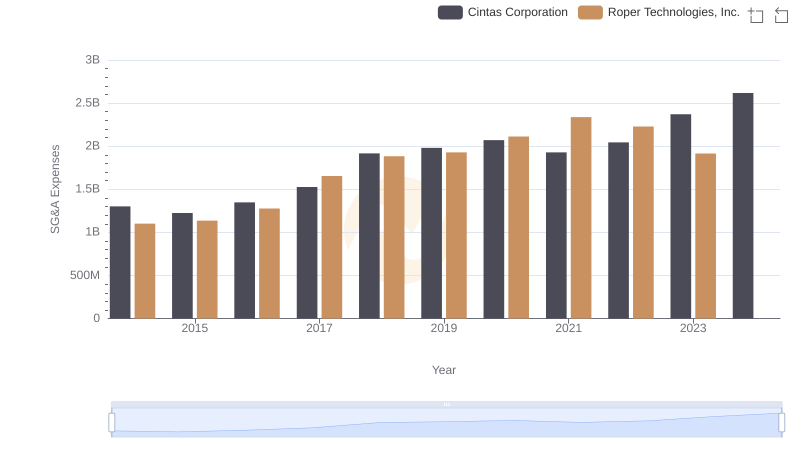
Comparing SG&A Expenses: Cintas Corporation vs Roper Technologies, Inc. Trends and Insights
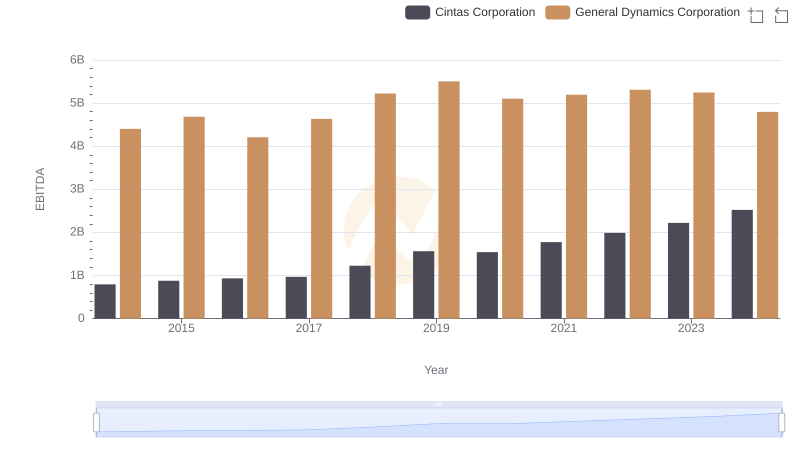
Comparative EBITDA Analysis: Cintas Corporation vs General Dynamics Corporation
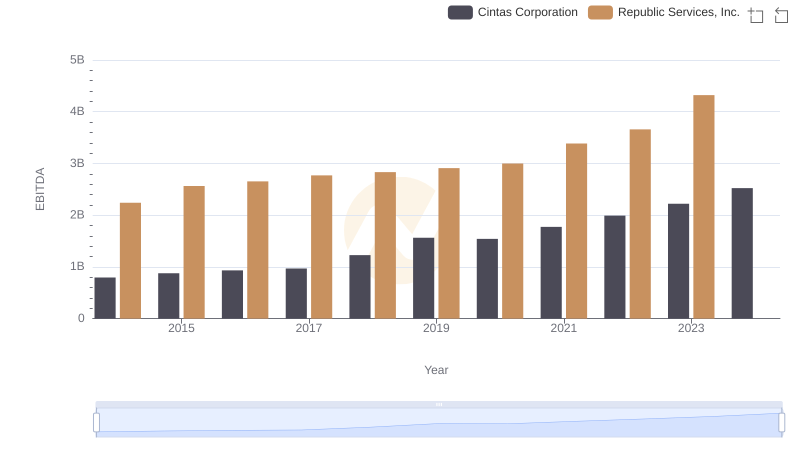
Cintas Corporation and Republic Services, Inc.: A Detailed Examination of EBITDA Performance
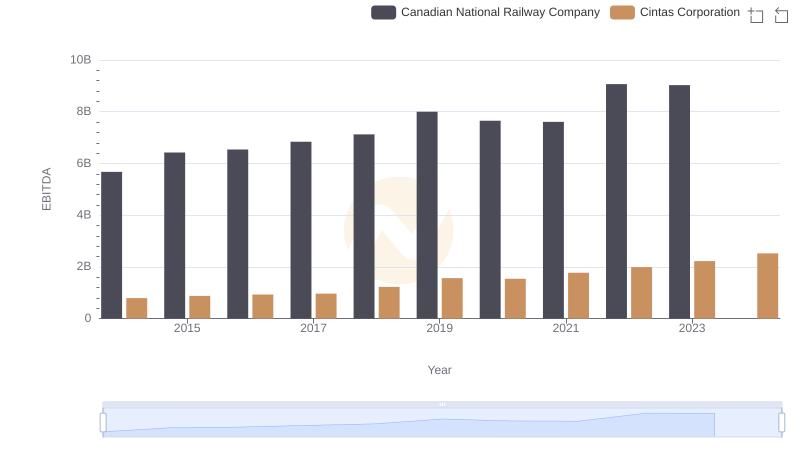
Professional EBITDA Benchmarking: Cintas Corporation vs Canadian National Railway Company
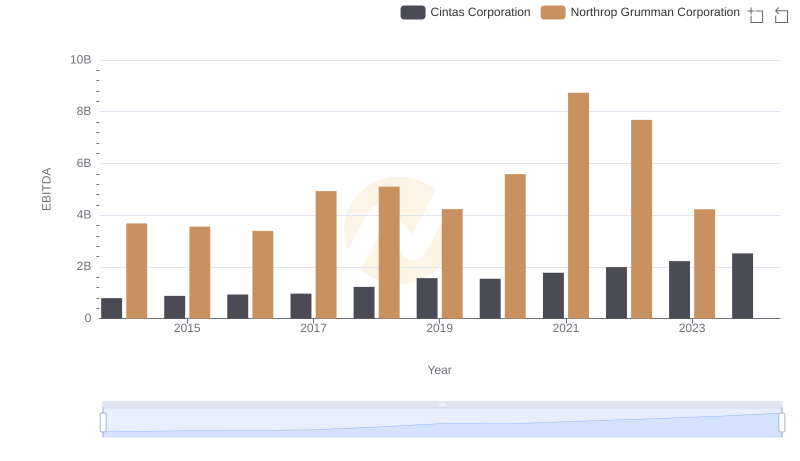
Comparative EBITDA Analysis: Cintas Corporation vs Northrop Grumman Corporation
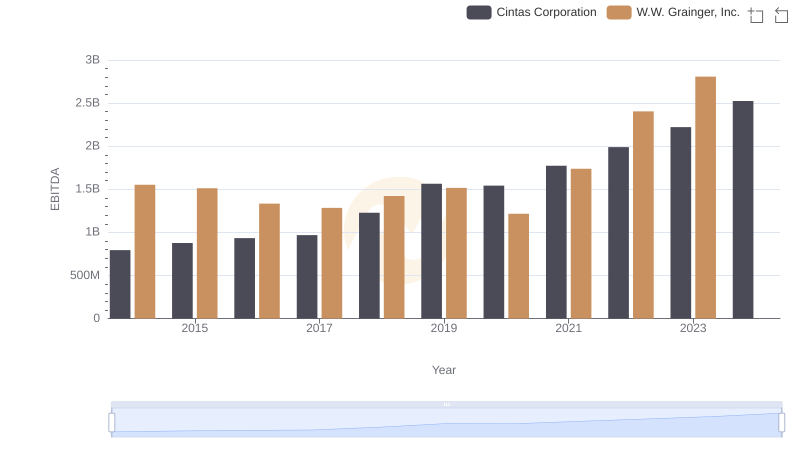
Cintas Corporation vs W.W. Grainger, Inc.: In-Depth EBITDA Performance Comparison
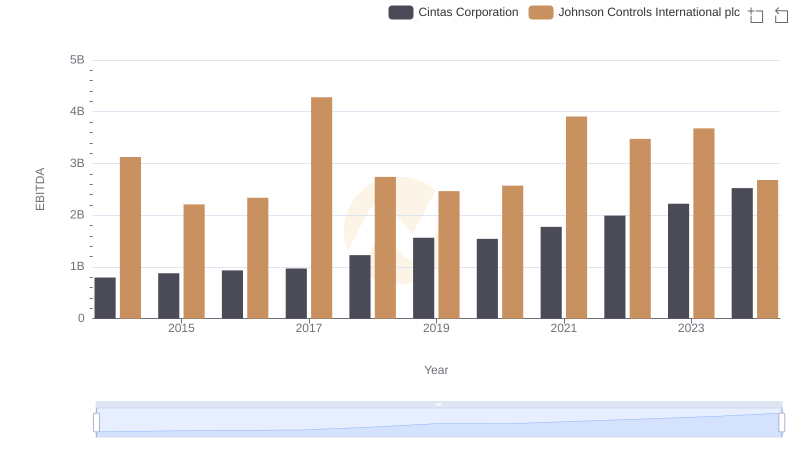
EBITDA Performance Review: Cintas Corporation vs Johnson Controls International plc
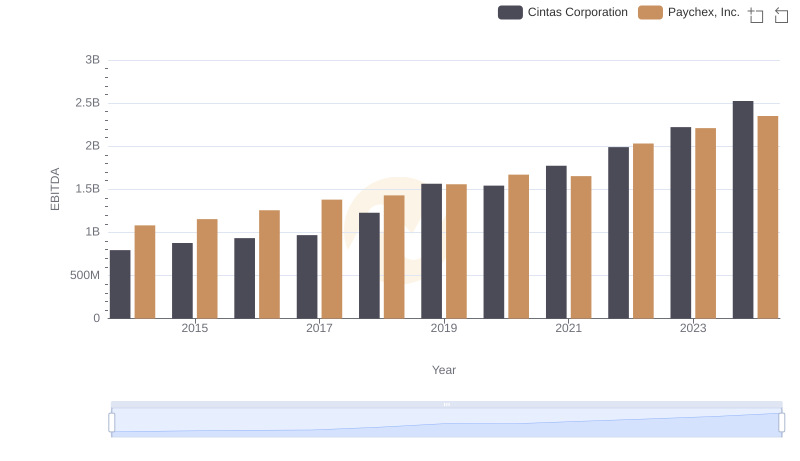
Comparative EBITDA Analysis: Cintas Corporation vs Paychex, Inc.