| __timestamp | Cintas Corporation | Northrop Grumman Corporation |
|---|---|---|
| Wednesday, January 1, 2014 | 793811000 | 3681000000 |
| Thursday, January 1, 2015 | 877761000 | 3558000000 |
| Friday, January 1, 2016 | 933728000 | 3394000000 |
| Sunday, January 1, 2017 | 968293000 | 4928000000 |
| Monday, January 1, 2018 | 1227852000 | 5104000000 |
| Tuesday, January 1, 2019 | 1564228000 | 4234000000 |
| Wednesday, January 1, 2020 | 1542737000 | 5588000000 |
| Friday, January 1, 2021 | 1773591000 | 8734000000 |
| Saturday, January 1, 2022 | 1990046000 | 7684000000 |
| Sunday, January 1, 2023 | 2221676000 | 4229000000 |
| Monday, January 1, 2024 | 2523857000 | 4370000000 |
In pursuit of knowledge
In the world of corporate finance, EBITDA serves as a crucial indicator of a company's operational profitability. Over the past decade, Cintas Corporation and Northrop Grumman Corporation have showcased contrasting trajectories in their EBITDA performance. From 2014 to 2023, Cintas has seen a remarkable growth of approximately 218%, with its EBITDA rising from around $794 million to over $2.2 billion. This growth reflects Cintas's strategic expansion and operational efficiency in the uniform and facility services industry.
Conversely, Northrop Grumman, a leader in the defense sector, experienced a more volatile EBITDA trend. Despite a peak in 2021, where EBITDA soared to nearly $8.7 billion, recent years have shown a decline, with 2023 figures dropping to about $4.2 billion. This fluctuation highlights the challenges faced by defense contractors in adapting to changing geopolitical and economic landscapes. Notably, data for 2024 is incomplete, leaving room for speculation on future trends.
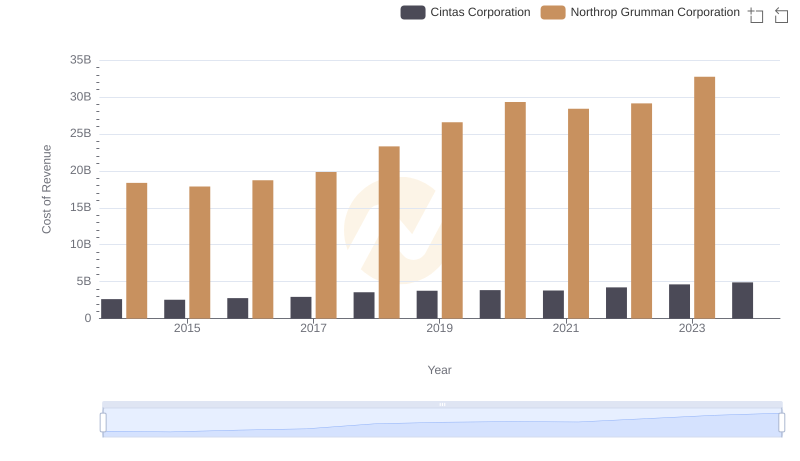
Cost of Revenue: Key Insights for Cintas Corporation and Northrop Grumman Corporation
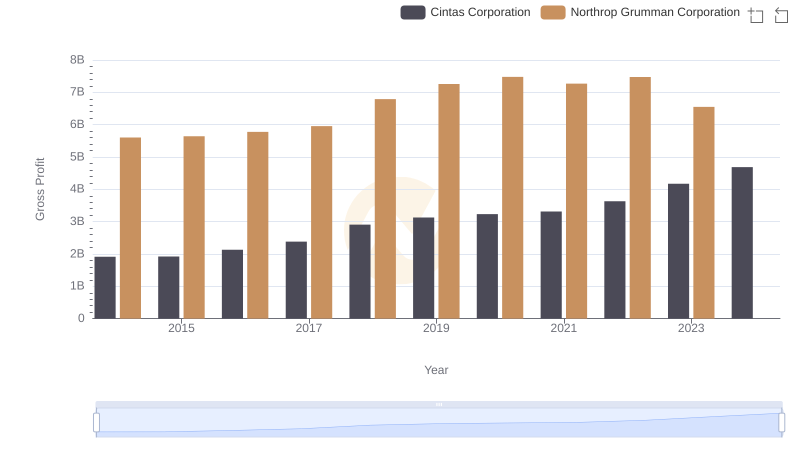
Cintas Corporation and Northrop Grumman Corporation: A Detailed Gross Profit Analysis
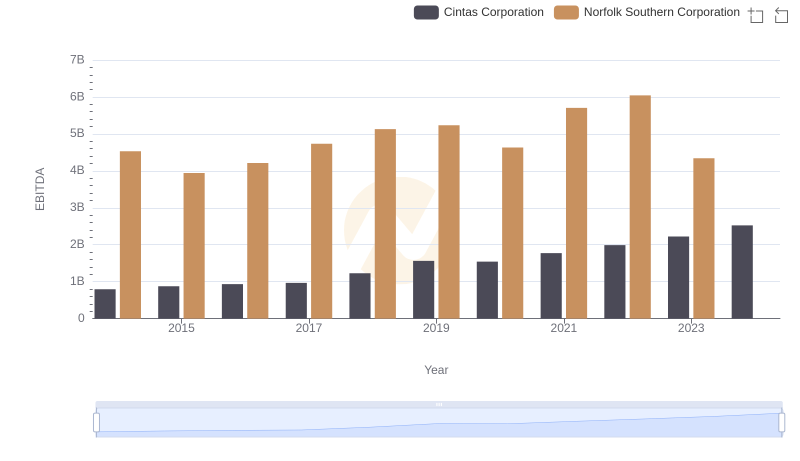
A Side-by-Side Analysis of EBITDA: Cintas Corporation and Norfolk Southern Corporation
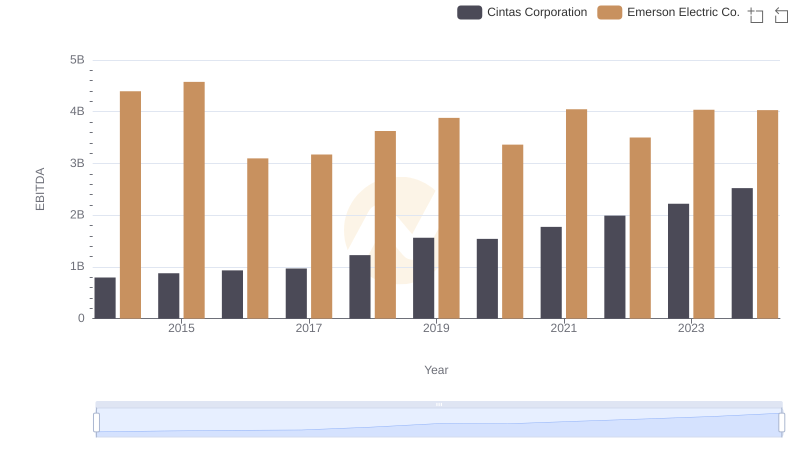
Comparative EBITDA Analysis: Cintas Corporation vs Emerson Electric Co.
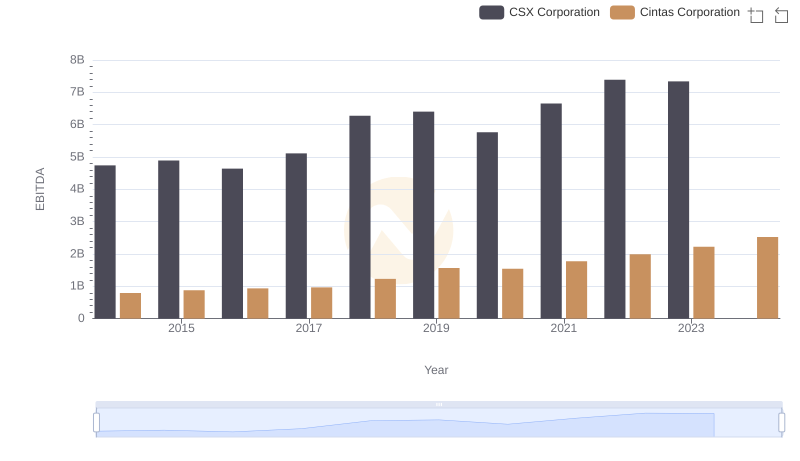
A Side-by-Side Analysis of EBITDA: Cintas Corporation and CSX Corporation
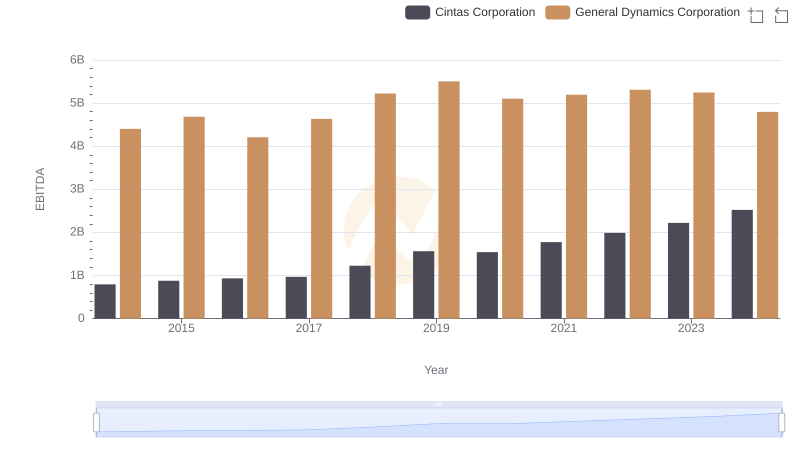
Comparative EBITDA Analysis: Cintas Corporation vs General Dynamics Corporation
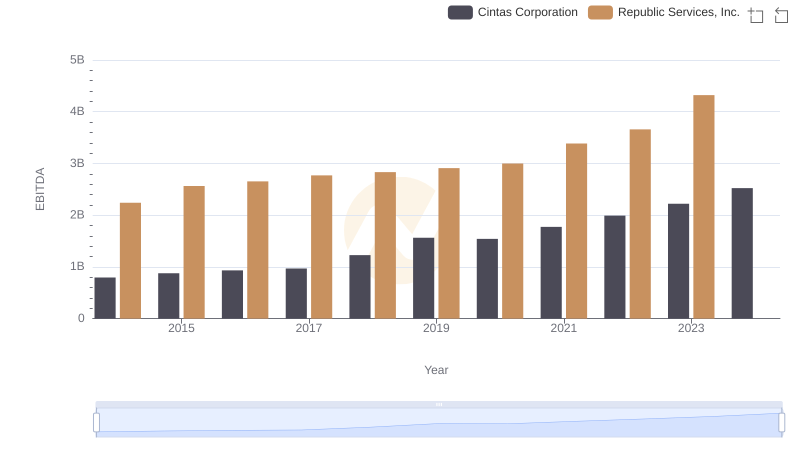
Cintas Corporation and Republic Services, Inc.: A Detailed Examination of EBITDA Performance
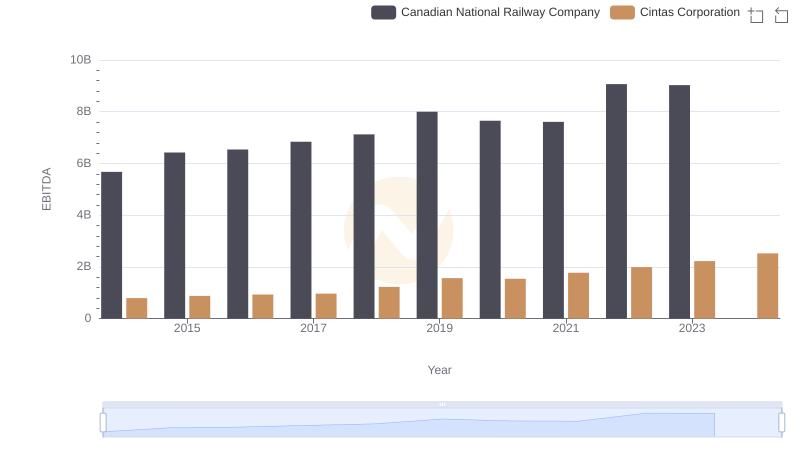
Professional EBITDA Benchmarking: Cintas Corporation vs Canadian National Railway Company
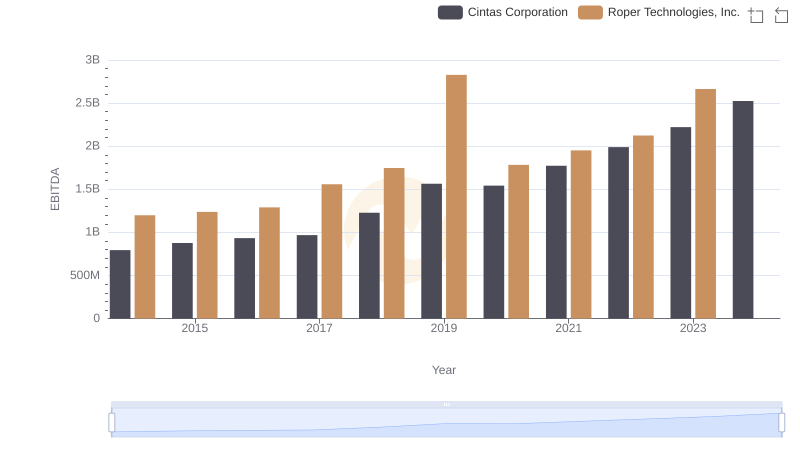
Comprehensive EBITDA Comparison: Cintas Corporation vs Roper Technologies, Inc.
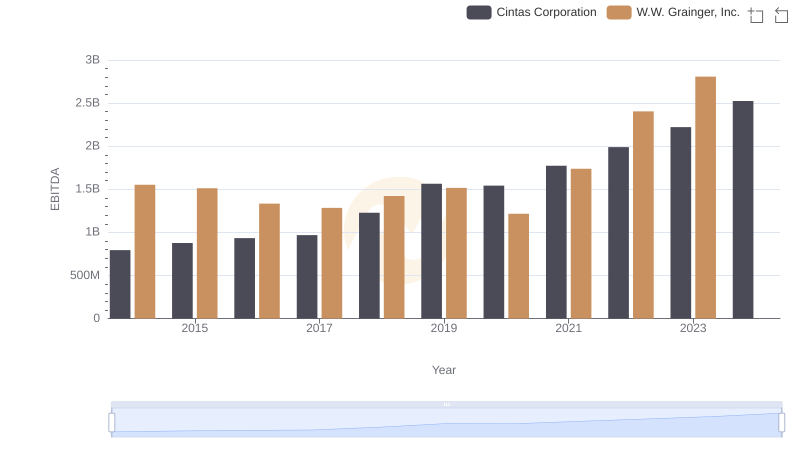
Cintas Corporation vs W.W. Grainger, Inc.: In-Depth EBITDA Performance Comparison