| __timestamp | Cintas Corporation | PACCAR Inc |
|---|---|---|
| Wednesday, January 1, 2014 | 793811000 | 2896200000 |
| Thursday, January 1, 2015 | 877761000 | 3212900000 |
| Friday, January 1, 2016 | 933728000 | 3745900000 |
| Sunday, January 1, 2017 | 968293000 | 3215800000 |
| Monday, January 1, 2018 | 1227852000 | 3681700000 |
| Tuesday, January 1, 2019 | 1564228000 | 3969900000 |
| Wednesday, January 1, 2020 | 1542737000 | 2581000000 |
| Friday, January 1, 2021 | 1773591000 | 3268200000 |
| Saturday, January 1, 2022 | 1990046000 | 4407800000 |
| Sunday, January 1, 2023 | 2221676000 | 6626900000 |
| Monday, January 1, 2024 | 2523857000 | 4456800000 |
Unlocking the unknown
In the competitive landscape of American industry, Cintas Corporation and PACCAR Inc. have demonstrated remarkable EBITDA growth over the past decade. From 2014 to 2024, Cintas Corporation's EBITDA surged by over 200%, reflecting its strategic expansion and operational efficiency. Meanwhile, PACCAR Inc. showcased a robust 54% increase, underscoring its resilience in the automotive sector.
Cintas Corporation: Starting at approximately $794 million in 2014, Cintas reached an impressive $2.5 billion by 2024. This growth trajectory highlights its successful adaptation to market demands and cost management.
PACCAR Inc.: Despite fluctuations, PACCAR's EBITDA peaked at $6.6 billion in 2023, before stabilizing at $4.5 billion in 2024. This reflects its ability to navigate economic cycles and maintain profitability.
These insights provide a compelling narrative of strategic growth and resilience in two distinct sectors.
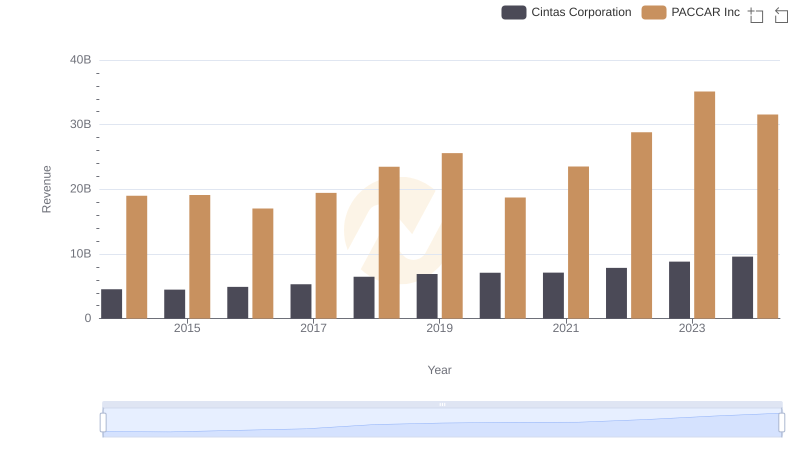
Who Generates More Revenue? Cintas Corporation or PACCAR Inc
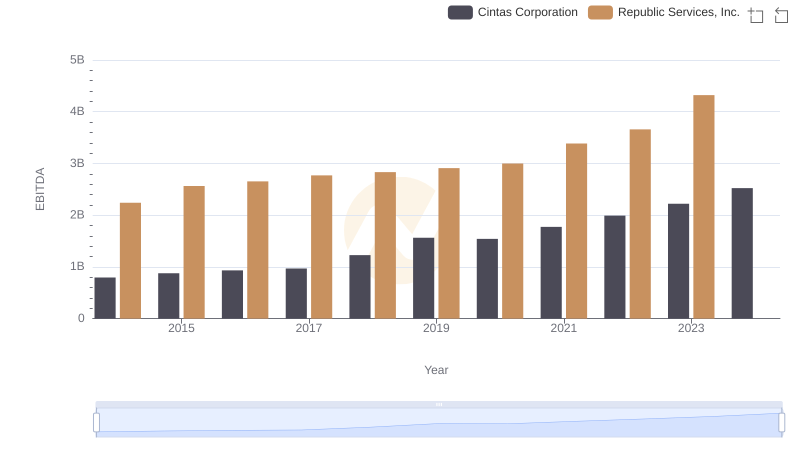
Cintas Corporation and Republic Services, Inc.: A Detailed Examination of EBITDA Performance
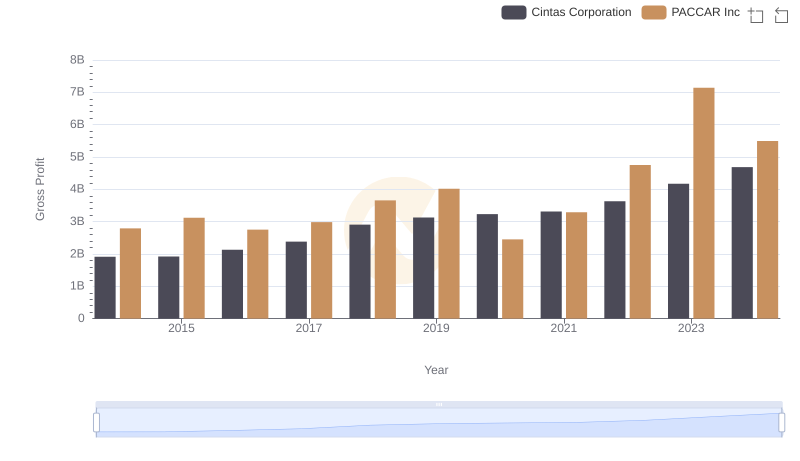
Gross Profit Comparison: Cintas Corporation and PACCAR Inc Trends
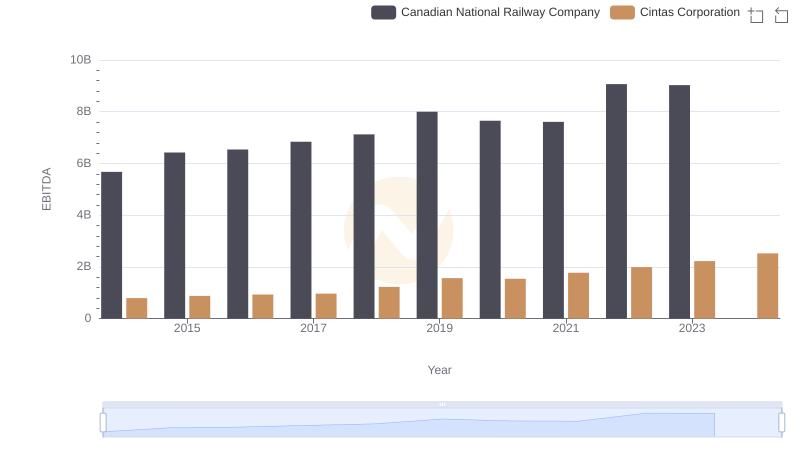
Professional EBITDA Benchmarking: Cintas Corporation vs Canadian National Railway Company
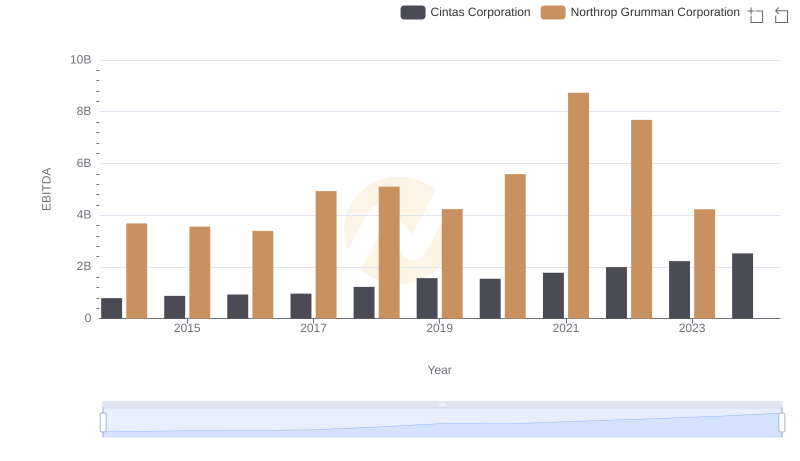
Comparative EBITDA Analysis: Cintas Corporation vs Northrop Grumman Corporation
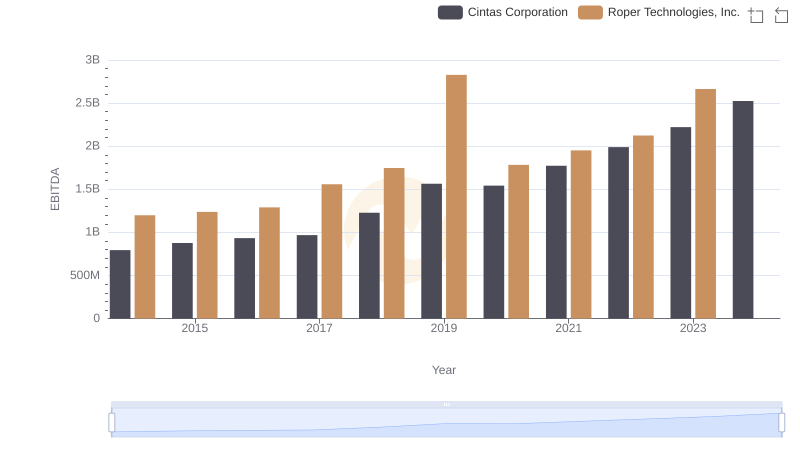
Comprehensive EBITDA Comparison: Cintas Corporation vs Roper Technologies, Inc.
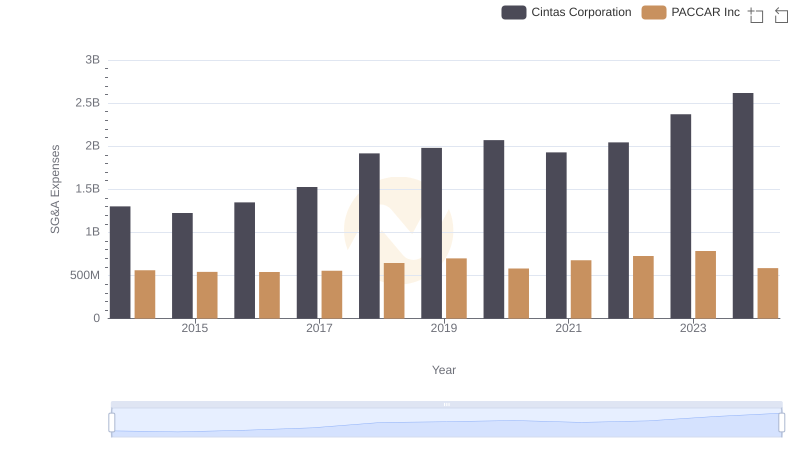
Cost Management Insights: SG&A Expenses for Cintas Corporation and PACCAR Inc
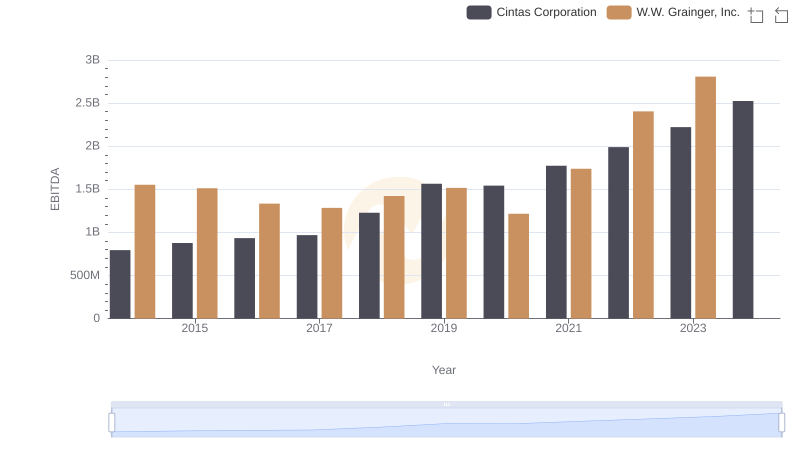
Cintas Corporation vs W.W. Grainger, Inc.: In-Depth EBITDA Performance Comparison
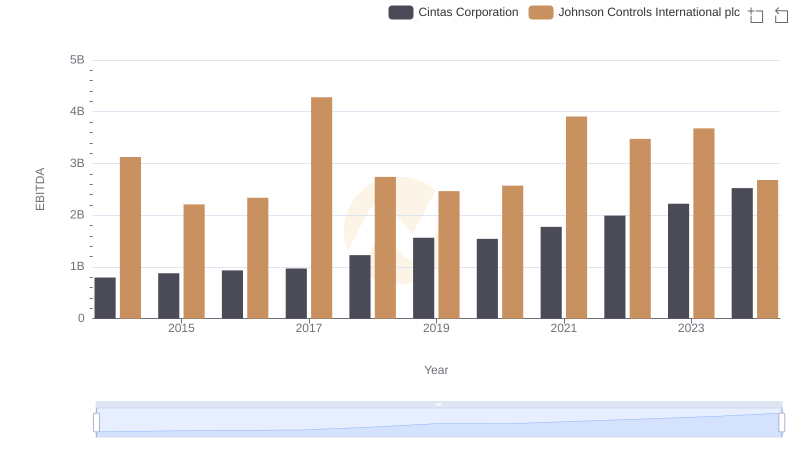
EBITDA Performance Review: Cintas Corporation vs Johnson Controls International plc
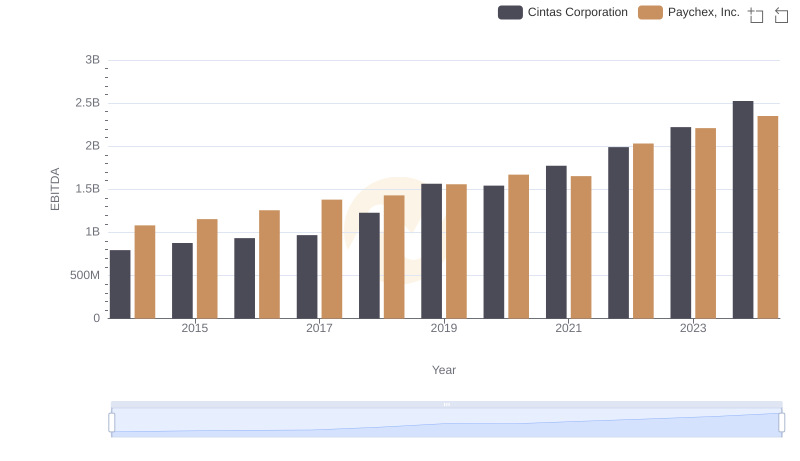
Comparative EBITDA Analysis: Cintas Corporation vs Paychex, Inc.
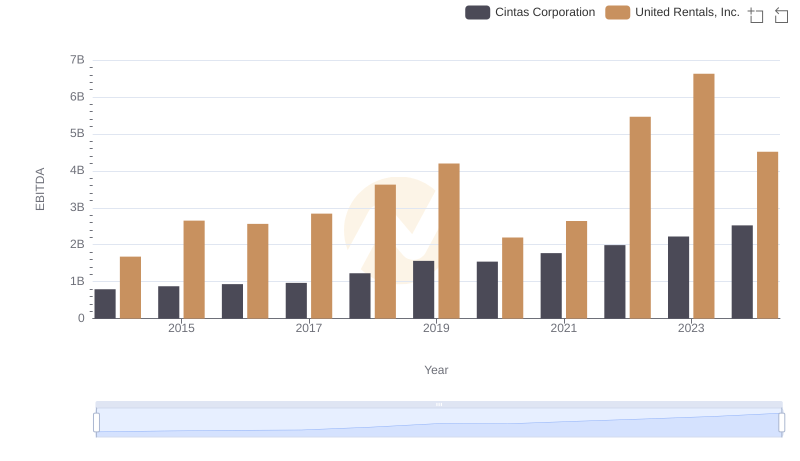
Comprehensive EBITDA Comparison: Cintas Corporation vs United Rentals, Inc.