| __timestamp | Quanta Services, Inc. | Waste Connections, Inc. |
|---|---|---|
| Wednesday, January 1, 2014 | 671899000 | 717805000 |
| Thursday, January 1, 2015 | 497247000 | 191002871 |
| Friday, January 1, 2016 | 524498000 | 900371894 |
| Sunday, January 1, 2017 | 647748000 | 1380632000 |
| Monday, January 1, 2018 | 824909000 | 1442229014 |
| Tuesday, January 1, 2019 | 862368000 | 1650754605 |
| Wednesday, January 1, 2020 | 911029000 | 1597555000 |
| Friday, January 1, 2021 | 1052832000 | 1891001000 |
| Saturday, January 1, 2022 | 1483091000 | 2090554149 |
| Sunday, January 1, 2023 | 1770669000 | 2261354000 |
| Monday, January 1, 2024 | 2389779000 |
Igniting the spark of knowledge
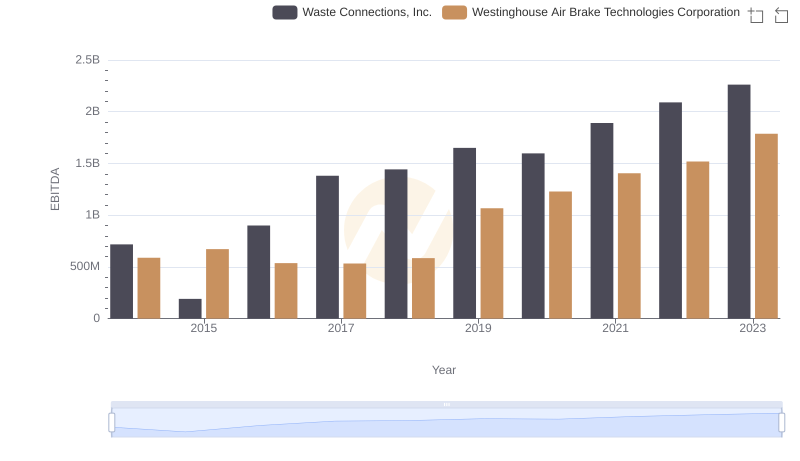
In the ever-evolving landscape of the waste management and infrastructure sectors, Waste Connections, Inc. and Quanta Services, Inc. have emerged as formidable players. Over the past decade, from 2014 to 2023, these companies have demonstrated remarkable growth in their EBITDA, a key indicator of financial health and operational efficiency.
Waste Connections, Inc. has seen its EBITDA soar by approximately 215%, reflecting its strategic expansions and operational efficiencies. Meanwhile, Quanta Services, Inc. has achieved an impressive 163% increase, underscoring its robust performance in the infrastructure services sector.
By 2023, Waste Connections, Inc. led with an EBITDA of over 2.26 billion, while Quanta Services, Inc. reached 1.77 billion. This data not only highlights their financial prowess but also their resilience in navigating industry challenges. As these giants continue to innovate, stakeholders can anticipate further growth and value creation.
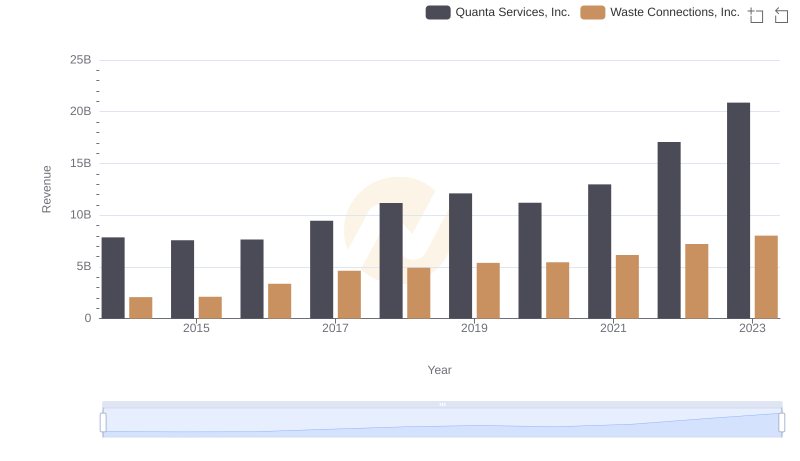
Comparing Revenue Performance: Waste Connections, Inc. or Quanta Services, Inc.?
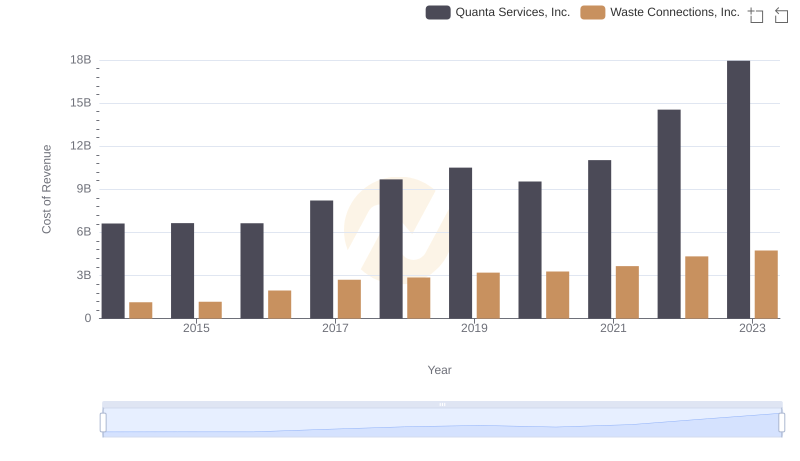
Cost of Revenue: Key Insights for Waste Connections, Inc. and Quanta Services, Inc.
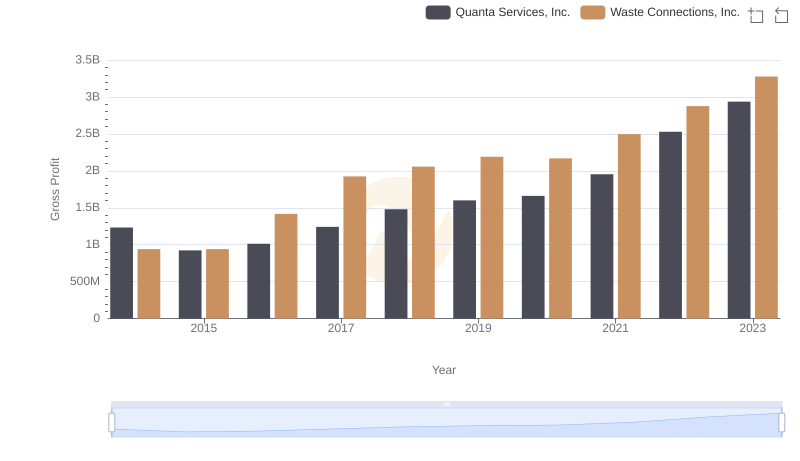
Gross Profit Comparison: Waste Connections, Inc. and Quanta Services, Inc. Trends
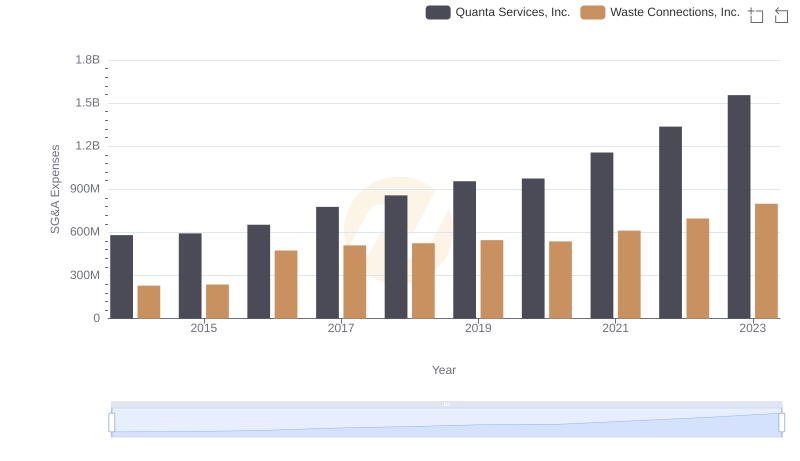
Waste Connections, Inc. vs Quanta Services, Inc.: SG&A Expense Trends
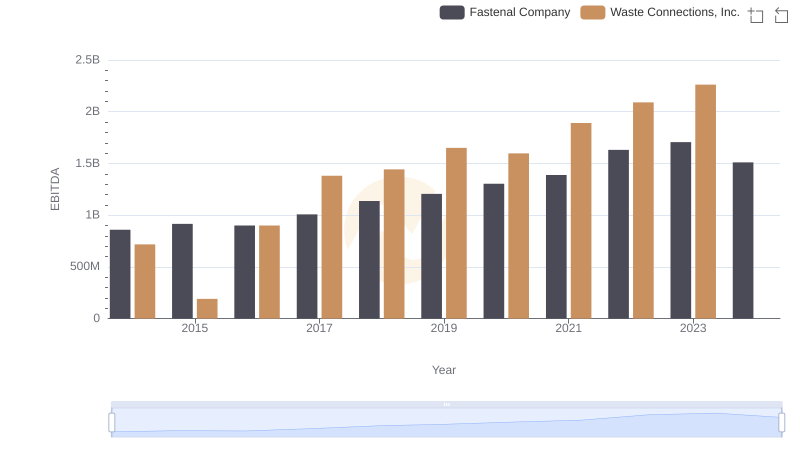
EBITDA Performance Review: Waste Connections, Inc. vs Fastenal Company
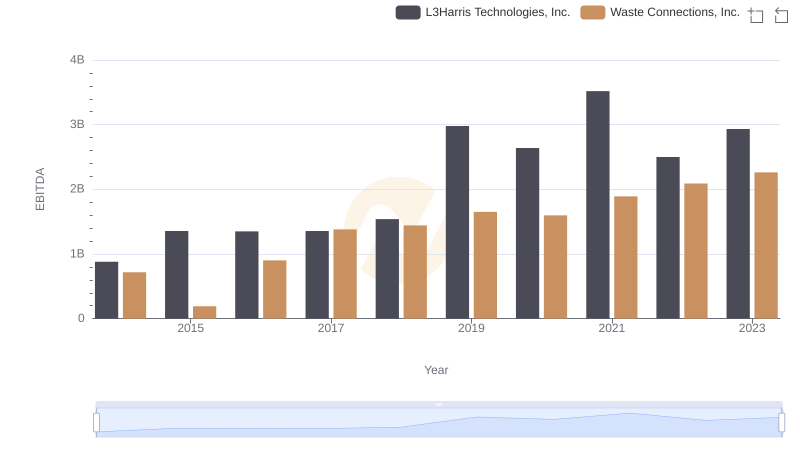
EBITDA Metrics Evaluated: Waste Connections, Inc. vs L3Harris Technologies, Inc.

EBITDA Metrics Evaluated: Waste Connections, Inc. vs Ferguson plc

EBITDA Metrics Evaluated: Waste Connections, Inc. vs Old Dominion Freight Line, Inc.
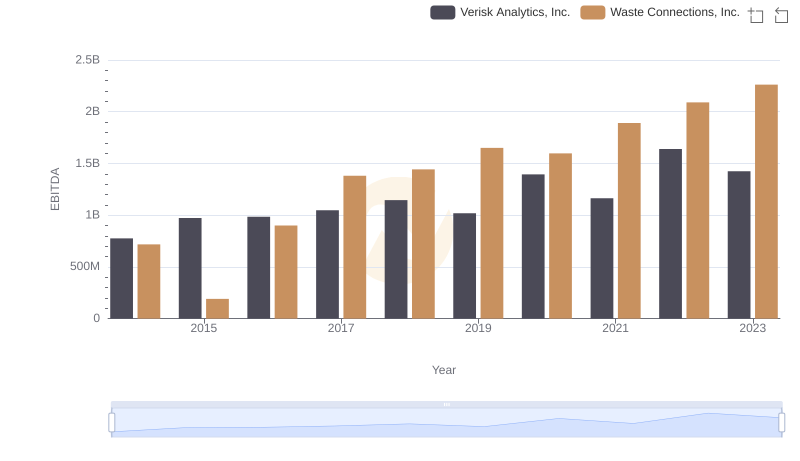
EBITDA Performance Review: Waste Connections, Inc. vs Verisk Analytics, Inc.
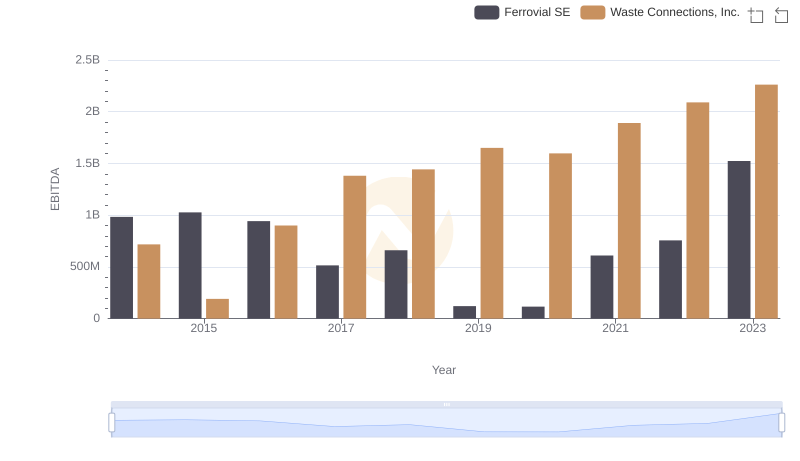
EBITDA Performance Review: Waste Connections, Inc. vs Ferrovial SE
EBITDA Performance Review: Waste Connections, Inc. vs Westinghouse Air Brake Technologies Corporation