| __timestamp | Quanta Services, Inc. | Waste Connections, Inc. |
|---|---|---|
| Wednesday, January 1, 2014 | 7851250000 | 2079166000 |
| Thursday, January 1, 2015 | 7572436000 | 2117287000 |
| Friday, January 1, 2016 | 7651319000 | 3375863000 |
| Sunday, January 1, 2017 | 9466478000 | 4630488000 |
| Monday, January 1, 2018 | 11171423000 | 4922941000 |
| Tuesday, January 1, 2019 | 12112153000 | 5388679000 |
| Wednesday, January 1, 2020 | 11202672000 | 5445990000 |
| Friday, January 1, 2021 | 12980213000 | 6151361000 |
| Saturday, January 1, 2022 | 17073903000 | 7211859000 |
| Sunday, January 1, 2023 | 20882206000 | 8021951000 |
| Monday, January 1, 2024 | 8919591000 |
Data in motion
In the ever-evolving landscape of the waste management and infrastructure sectors, Waste Connections, Inc. and Quanta Services, Inc. have emerged as formidable players. Over the past decade, Quanta Services has demonstrated a robust revenue growth trajectory, with a remarkable 176% increase from 2014 to 2023. This growth is underscored by a significant leap in revenue from approximately $7.9 billion in 2014 to over $20.9 billion in 2023. Meanwhile, Waste Connections has also shown impressive progress, with its revenue more than tripling from $2.1 billion to $8 billion during the same period. This comparison highlights Quanta Services' aggressive expansion strategy, outpacing Waste Connections by a factor of 2.6 in 2023. As these companies continue to innovate and expand, their financial performance offers valuable insights into the dynamics of their respective industries.
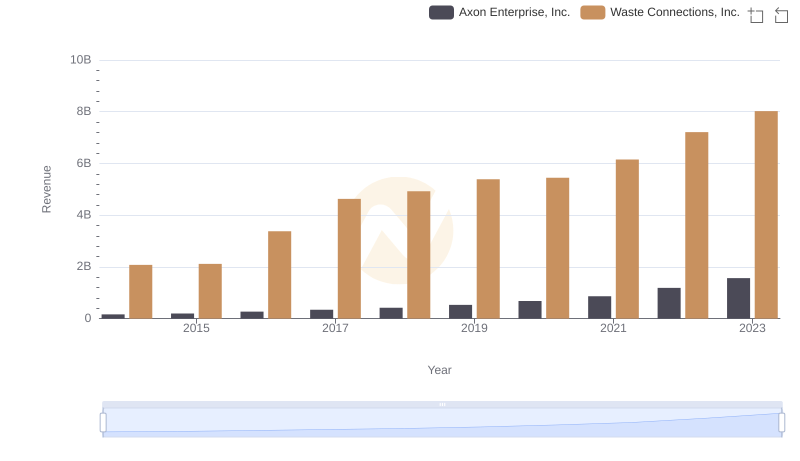
Waste Connections, Inc. vs Axon Enterprise, Inc.: Annual Revenue Growth Compared
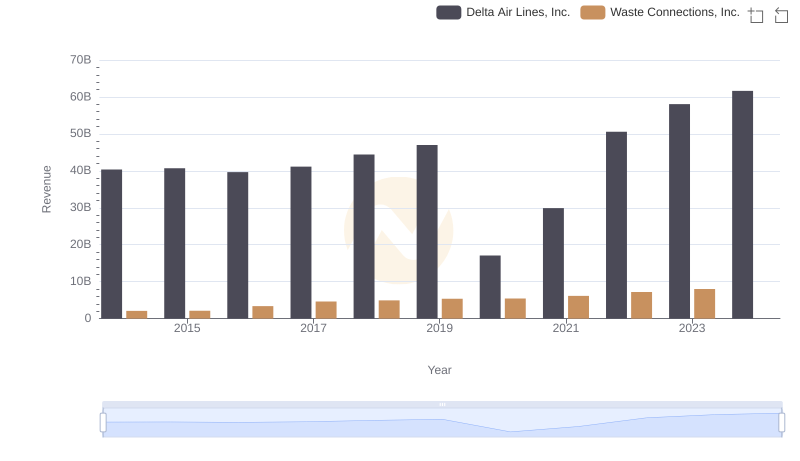
Comparing Revenue Performance: Waste Connections, Inc. or Delta Air Lines, Inc.?
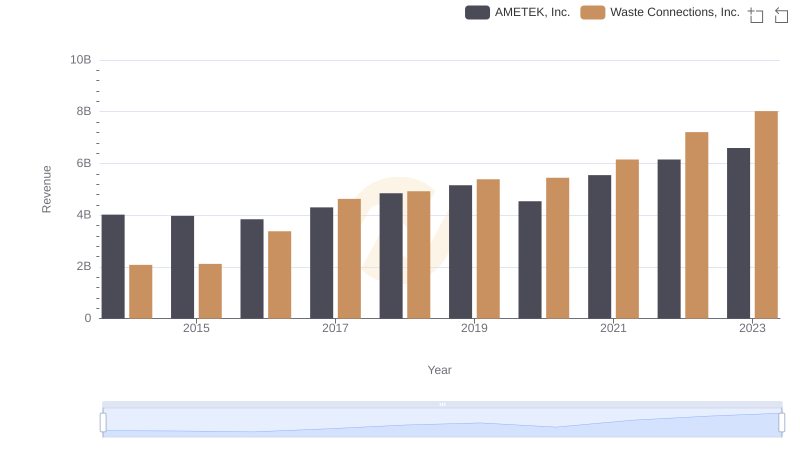
Revenue Insights: Waste Connections, Inc. and AMETEK, Inc. Performance Compared
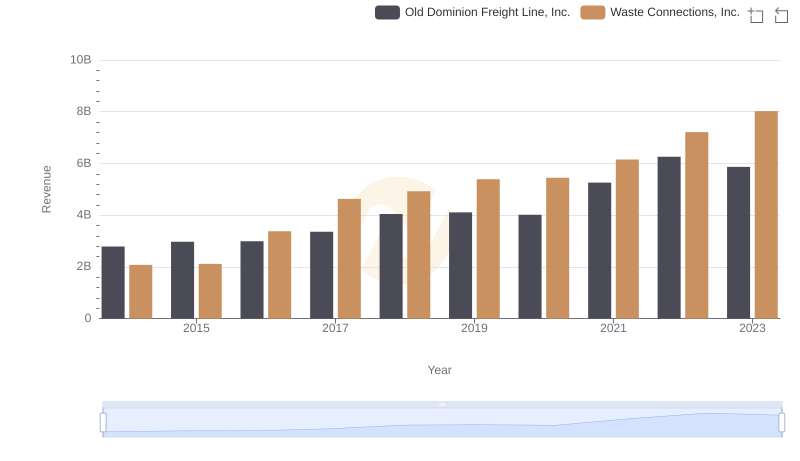
Waste Connections, Inc. and Old Dominion Freight Line, Inc.: A Comprehensive Revenue Analysis
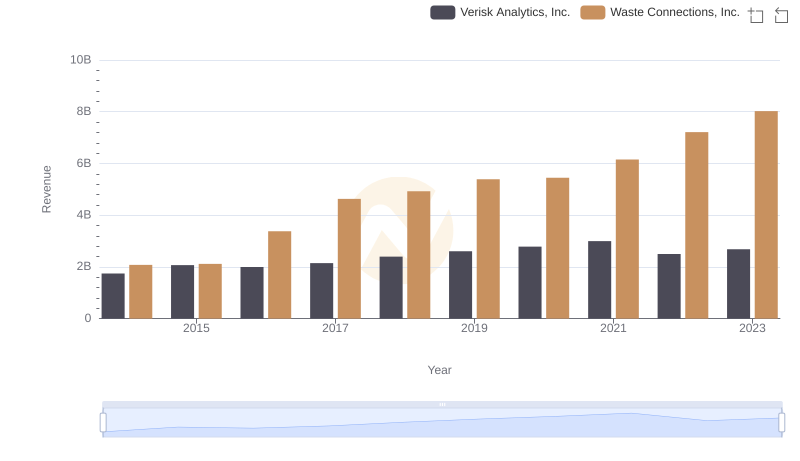
Revenue Showdown: Waste Connections, Inc. vs Verisk Analytics, Inc.
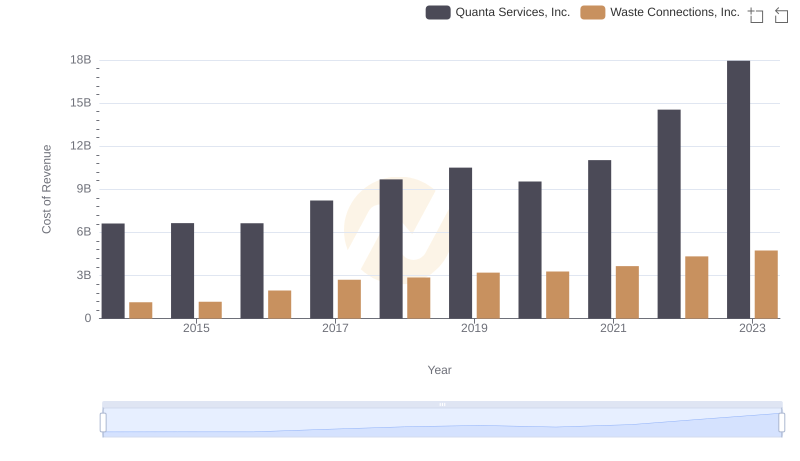
Cost of Revenue: Key Insights for Waste Connections, Inc. and Quanta Services, Inc.
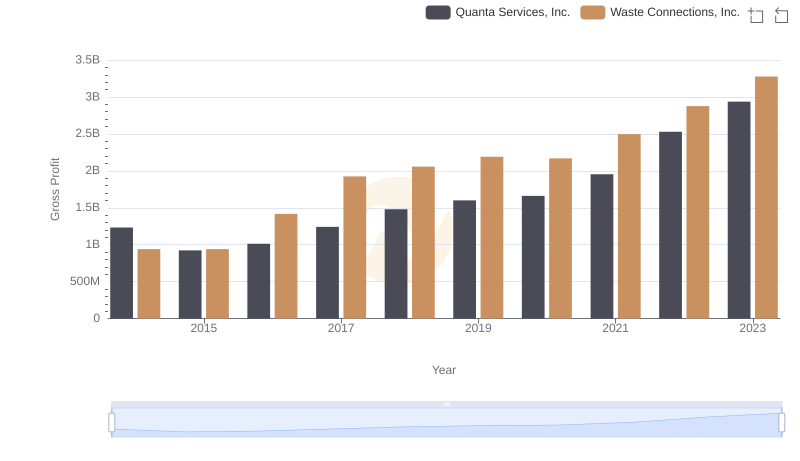
Gross Profit Comparison: Waste Connections, Inc. and Quanta Services, Inc. Trends
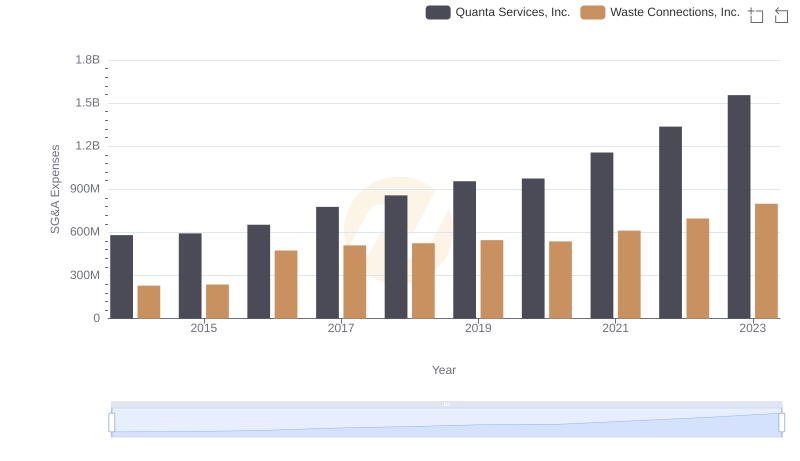
Waste Connections, Inc. vs Quanta Services, Inc.: SG&A Expense Trends

EBITDA Metrics Evaluated: Waste Connections, Inc. vs Quanta Services, Inc.