| __timestamp | Quanta Services, Inc. | Waste Connections, Inc. |
|---|---|---|
| Wednesday, January 1, 2014 | 6617730000 | 1138388000 |
| Thursday, January 1, 2015 | 6648771000 | 1177409000 |
| Friday, January 1, 2016 | 6637519000 | 1957712000 |
| Sunday, January 1, 2017 | 8224618000 | 2704775000 |
| Monday, January 1, 2018 | 9691459000 | 2865704000 |
| Tuesday, January 1, 2019 | 10511901000 | 3198757000 |
| Wednesday, January 1, 2020 | 9541825000 | 3276808000 |
| Friday, January 1, 2021 | 11026954000 | 3654074000 |
| Saturday, January 1, 2022 | 14544748000 | 4336012000 |
| Sunday, January 1, 2023 | 17945120000 | 4744513000 |
| Monday, January 1, 2024 | 5191706000 |
Infusing magic into the data realm
In the ever-evolving landscape of industrial services, understanding cost dynamics is crucial. Over the past decade, Quanta Services, Inc. and Waste Connections, Inc. have shown distinct trends in their cost of revenue. Quanta Services, a leader in infrastructure solutions, has seen its cost of revenue grow by approximately 171% from 2014 to 2023, reflecting its expanding operations and market reach. In contrast, Waste Connections, a prominent player in waste management, experienced a 317% increase over the same period, highlighting its strategic growth and efficiency improvements.
The data reveals that Quanta Services consistently maintained a higher cost of revenue, peaking at nearly $18 billion in 2023, compared to Waste Connections' $4.7 billion. This disparity underscores the scale and scope differences between the two companies. As we look to the future, these insights provide a valuable lens through which to assess industry trends and company strategies.
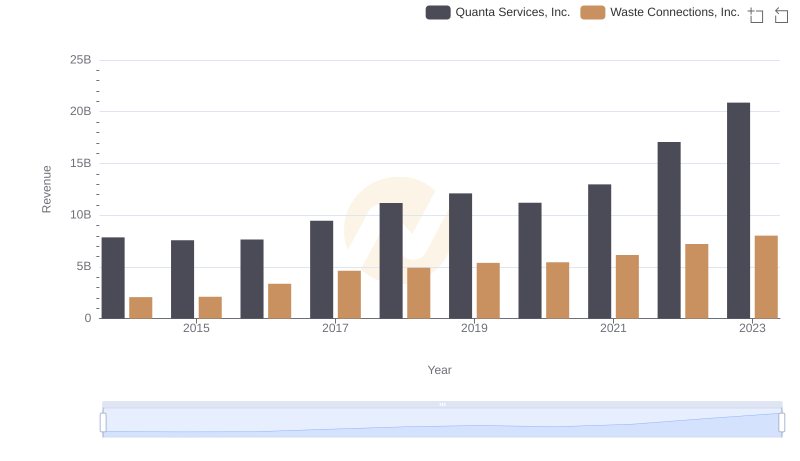
Comparing Revenue Performance: Waste Connections, Inc. or Quanta Services, Inc.?
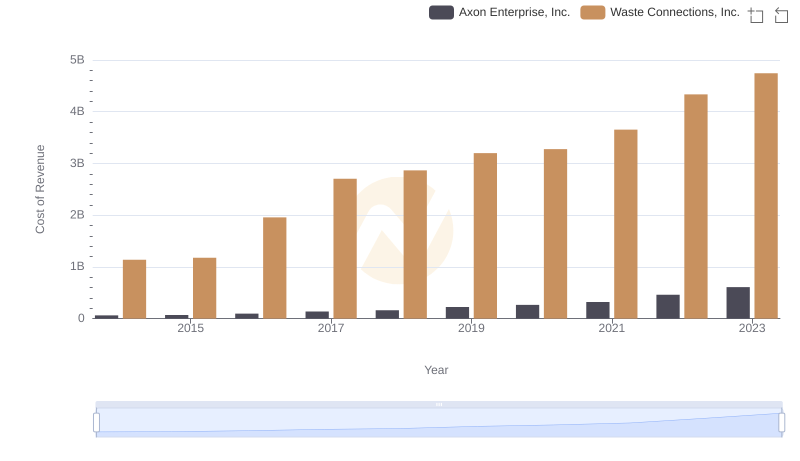
Cost of Revenue Comparison: Waste Connections, Inc. vs Axon Enterprise, Inc.
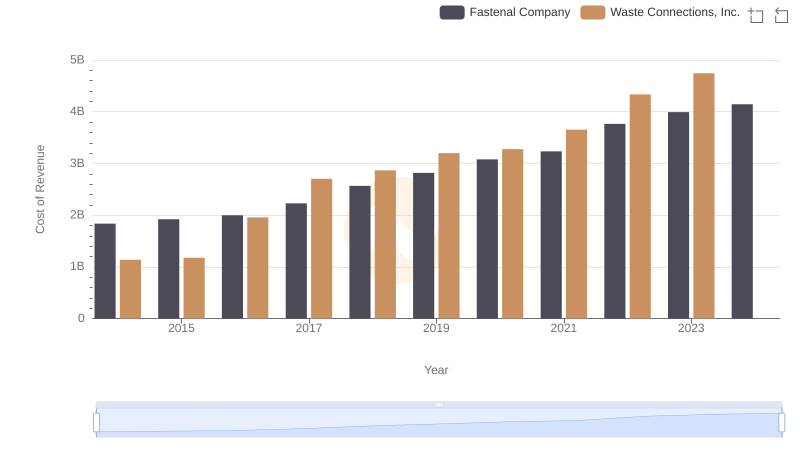
Comparing Cost of Revenue Efficiency: Waste Connections, Inc. vs Fastenal Company
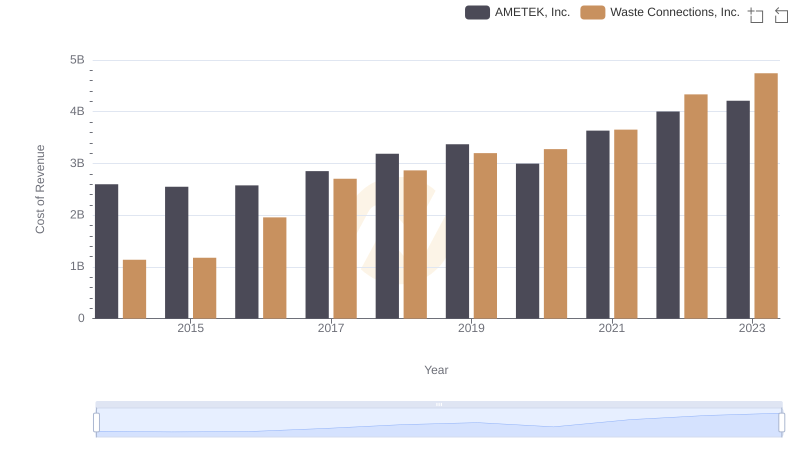
Cost of Revenue: Key Insights for Waste Connections, Inc. and AMETEK, Inc.
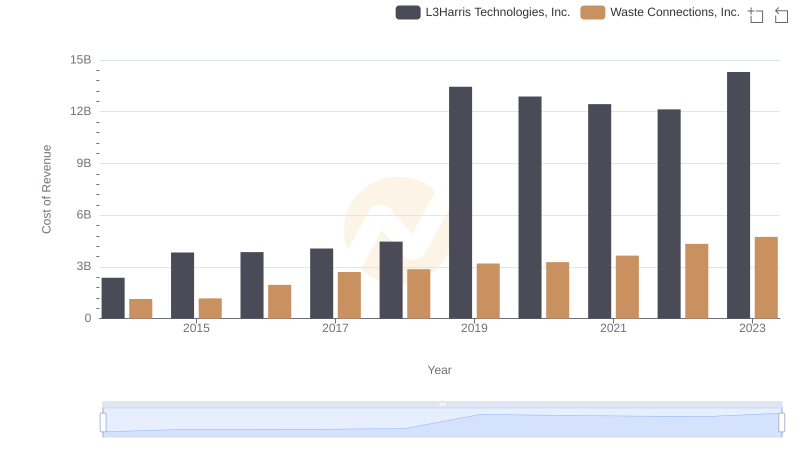
Cost of Revenue: Key Insights for Waste Connections, Inc. and L3Harris Technologies, Inc.
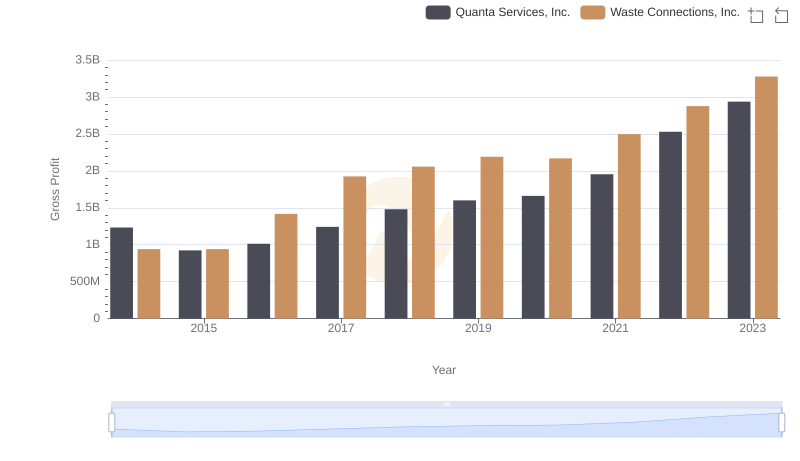
Gross Profit Comparison: Waste Connections, Inc. and Quanta Services, Inc. Trends
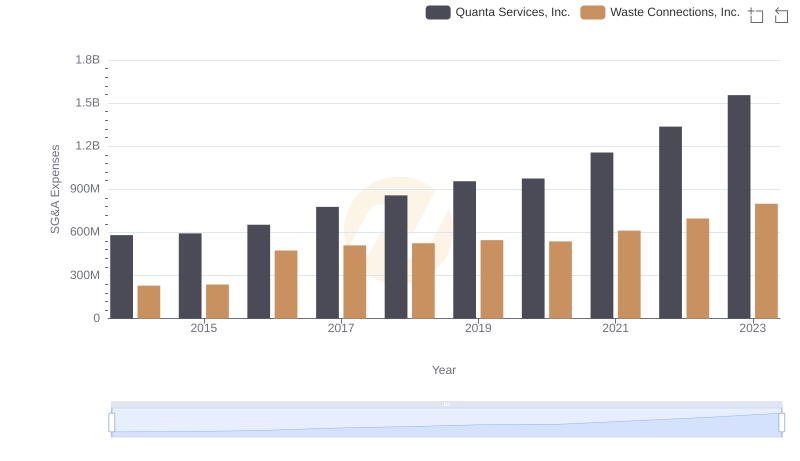
Waste Connections, Inc. vs Quanta Services, Inc.: SG&A Expense Trends

EBITDA Metrics Evaluated: Waste Connections, Inc. vs Quanta Services, Inc.