| __timestamp | Verisk Analytics, Inc. | Waste Connections, Inc. |
|---|---|---|
| Wednesday, January 1, 2014 | 776000000 | 717805000 |
| Thursday, January 1, 2015 | 972500000 | 191002871 |
| Friday, January 1, 2016 | 985300000 | 900371894 |
| Sunday, January 1, 2017 | 1047800000 | 1380632000 |
| Monday, January 1, 2018 | 1145500000 | 1442229014 |
| Tuesday, January 1, 2019 | 1018900000 | 1650754605 |
| Wednesday, January 1, 2020 | 1393800000 | 1597555000 |
| Friday, January 1, 2021 | 1163700000 | 1891001000 |
| Saturday, January 1, 2022 | 1639800000 | 2090554149 |
| Sunday, January 1, 2023 | 1424100000 | 2261354000 |
| Monday, January 1, 2024 | 2389779000 |
Unlocking the unknown
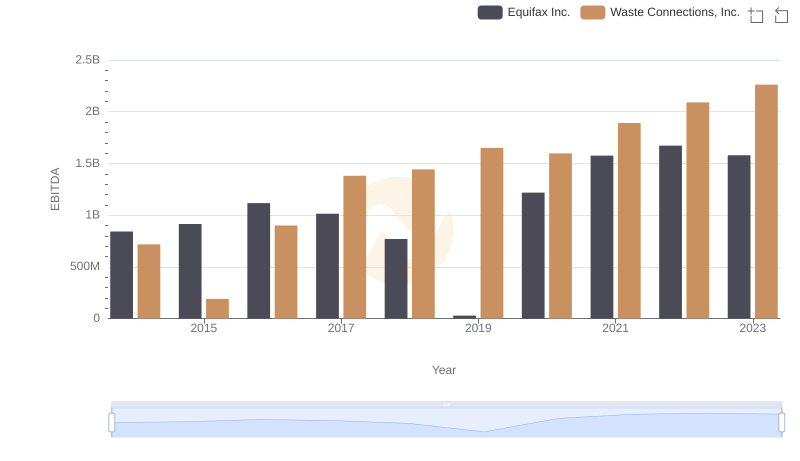
In the ever-evolving landscape of corporate finance, EBITDA serves as a crucial indicator of a company's operational efficiency. Over the past decade, Waste Connections, Inc. and Verisk Analytics, Inc. have demonstrated remarkable EBITDA growth, reflecting their strategic prowess and market adaptability.
From 2014 to 2023, Waste Connections, Inc. has seen its EBITDA surge by approximately 215%, reaching a peak in 2023. This growth trajectory underscores the company's robust expansion and operational excellence in the waste management sector. In contrast, Verisk Analytics, Inc. experienced a steady EBITDA increase of around 83% over the same period, highlighting its consistent performance in the analytics industry.
The data reveals a compelling narrative of two industry leaders navigating their respective markets with distinct strategies, offering valuable insights into their financial health and future potential.
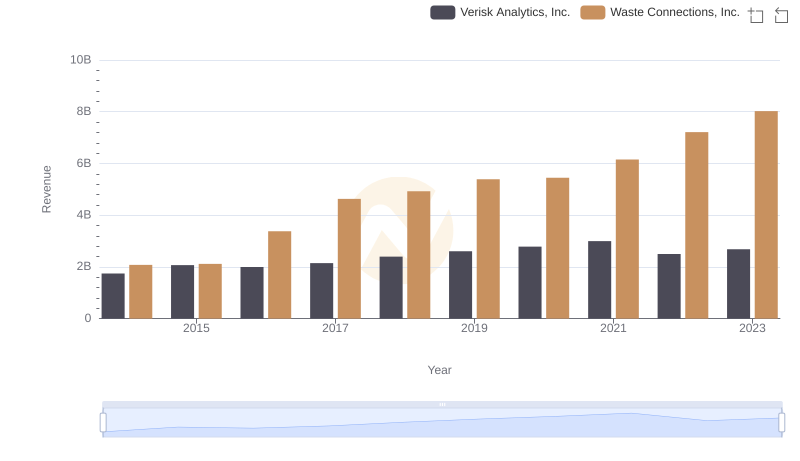
Revenue Showdown: Waste Connections, Inc. vs Verisk Analytics, Inc.
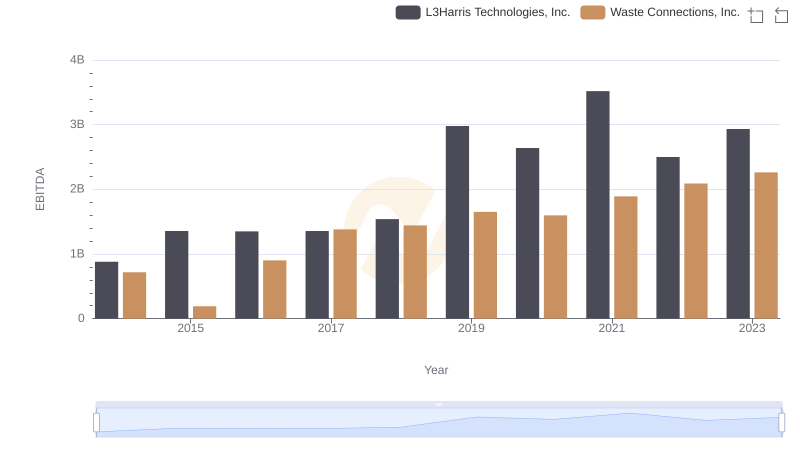
EBITDA Metrics Evaluated: Waste Connections, Inc. vs L3Harris Technologies, Inc.

EBITDA Metrics Evaluated: Waste Connections, Inc. vs Quanta Services, Inc.

EBITDA Metrics Evaluated: Waste Connections, Inc. vs Ferguson plc

EBITDA Metrics Evaluated: Waste Connections, Inc. vs Old Dominion Freight Line, Inc.
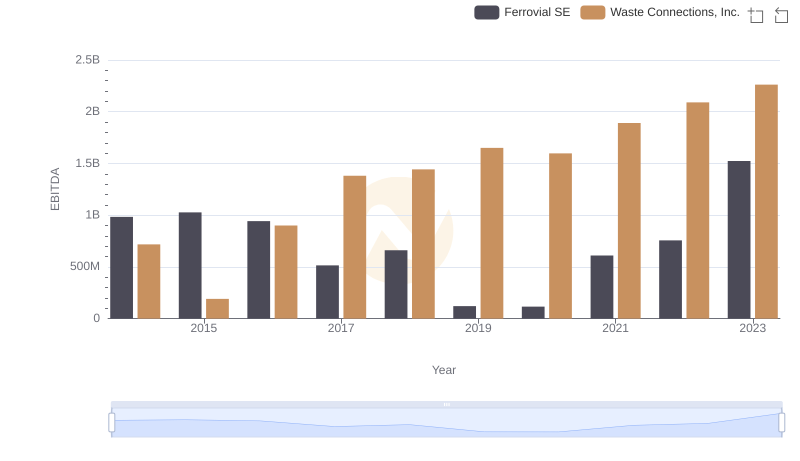
EBITDA Performance Review: Waste Connections, Inc. vs Ferrovial SE
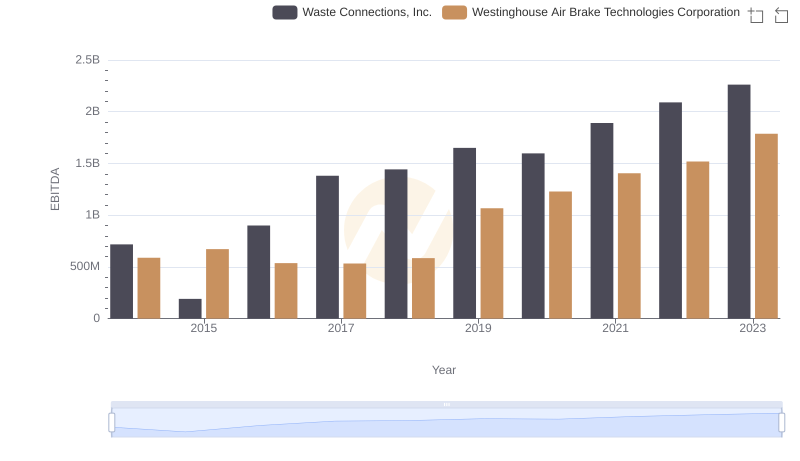
EBITDA Performance Review: Waste Connections, Inc. vs Westinghouse Air Brake Technologies Corporation
Professional EBITDA Benchmarking: Waste Connections, Inc. vs Equifax Inc.