| __timestamp | Old Dominion Freight Line, Inc. | Waste Connections, Inc. |
|---|---|---|
| Wednesday, January 1, 2014 | 585590000 | 717805000 |
| Thursday, January 1, 2015 | 660570000 | 191002871 |
| Friday, January 1, 2016 | 671786000 | 900371894 |
| Sunday, January 1, 2017 | 783749000 | 1380632000 |
| Monday, January 1, 2018 | 1046059000 | 1442229014 |
| Tuesday, January 1, 2019 | 1078007000 | 1650754605 |
| Wednesday, January 1, 2020 | 1168149000 | 1597555000 |
| Friday, January 1, 2021 | 1651501000 | 1891001000 |
| Saturday, January 1, 2022 | 2118962000 | 2090554149 |
| Sunday, January 1, 2023 | 1972689000 | 2261354000 |
| Monday, January 1, 2024 | 2389779000 |
Unleashing insights
In the competitive landscape of logistics and waste management, Waste Connections, Inc. and Old Dominion Freight Line, Inc. have shown remarkable EBITDA growth over the past decade. From 2014 to 2023, Waste Connections, Inc. saw its EBITDA soar by approximately 215%, peaking at $2.26 billion in 2023. Meanwhile, Old Dominion Freight Line, Inc. experienced a robust 237% increase, reaching $2.12 billion in 2022 before a slight dip in 2023.
Waste Connections, Inc. consistently outperformed Old Dominion Freight Line, Inc. in terms of EBITDA, except in 2022 when Old Dominion briefly took the lead. This trend highlights the resilience and strategic growth of Waste Connections, Inc. in the waste management sector. As these industry leaders continue to expand, their financial trajectories offer valuable insights into the evolving dynamics of their respective markets.
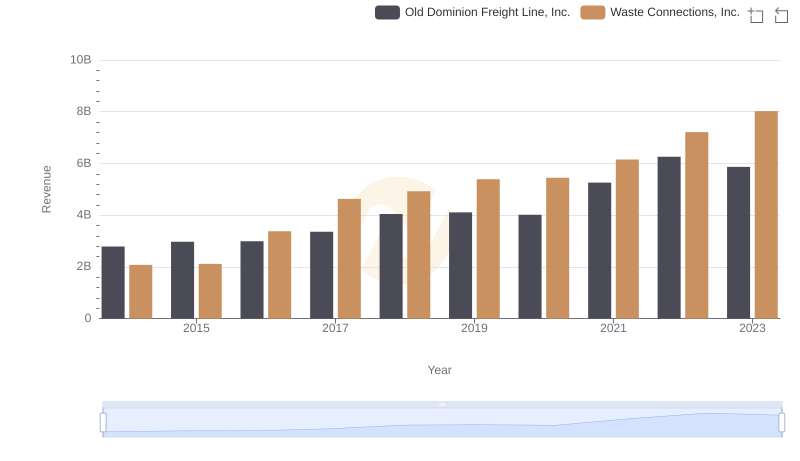
Waste Connections, Inc. and Old Dominion Freight Line, Inc.: A Comprehensive Revenue Analysis
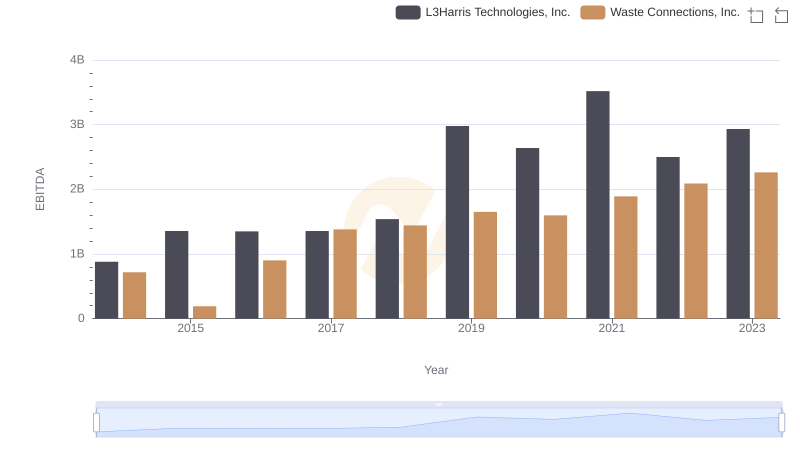
EBITDA Metrics Evaluated: Waste Connections, Inc. vs L3Harris Technologies, Inc.

EBITDA Metrics Evaluated: Waste Connections, Inc. vs Quanta Services, Inc.

EBITDA Metrics Evaluated: Waste Connections, Inc. vs Ferguson plc
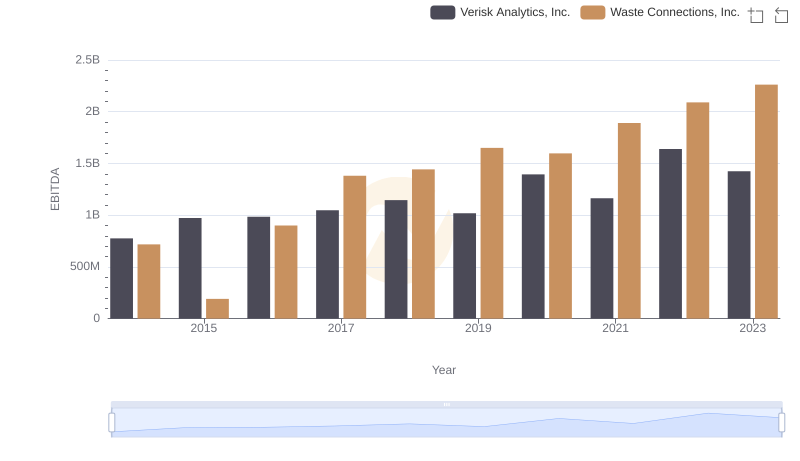
EBITDA Performance Review: Waste Connections, Inc. vs Verisk Analytics, Inc.
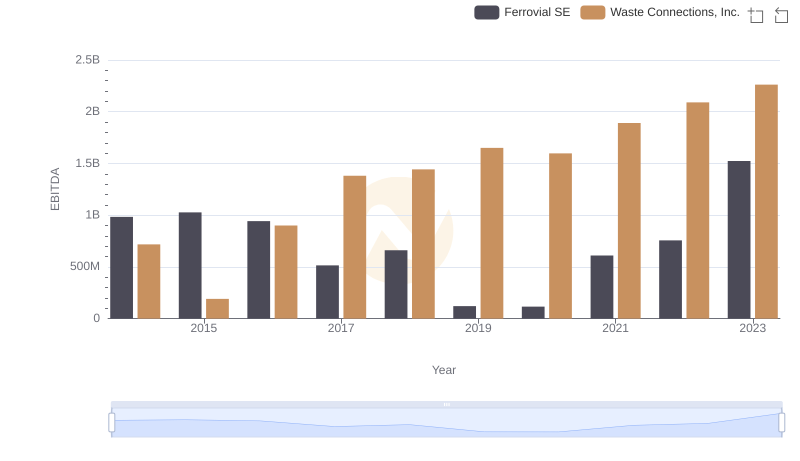
EBITDA Performance Review: Waste Connections, Inc. vs Ferrovial SE
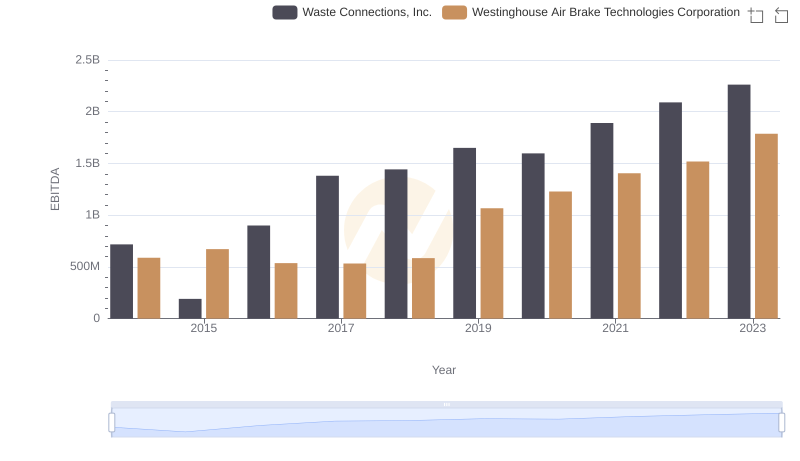
EBITDA Performance Review: Waste Connections, Inc. vs Westinghouse Air Brake Technologies Corporation
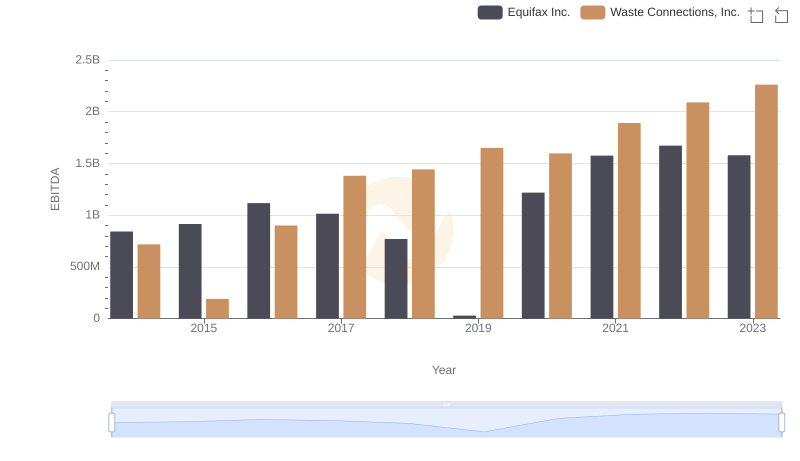
Professional EBITDA Benchmarking: Waste Connections, Inc. vs Equifax Inc.