| __timestamp | L3Harris Technologies, Inc. | Waste Connections, Inc. |
|---|---|---|
| Wednesday, January 1, 2014 | 879000000 | 717805000 |
| Thursday, January 1, 2015 | 1356000000 | 191002871 |
| Friday, January 1, 2016 | 1350000000 | 900371894 |
| Sunday, January 1, 2017 | 1356000000 | 1380632000 |
| Monday, January 1, 2018 | 1538000000 | 1442229014 |
| Tuesday, January 1, 2019 | 2980000000 | 1650754605 |
| Wednesday, January 1, 2020 | 2639000000 | 1597555000 |
| Friday, January 1, 2021 | 3518000000 | 1891001000 |
| Saturday, January 1, 2022 | 2499000000 | 2090554149 |
| Sunday, January 1, 2023 | 2932000000 | 2261354000 |
| Monday, January 1, 2024 | 3561000000 | 2389779000 |
Unleashing insights
In the ever-evolving landscape of corporate finance, EBITDA (Earnings Before Interest, Taxes, Depreciation, and Amortization) serves as a crucial metric for evaluating a company's operational performance. This analysis delves into the EBITDA trends of two industry giants: Waste Connections, Inc. and L3Harris Technologies, Inc., from 2014 to 2023.
L3Harris Technologies, a leader in defense and aerospace, showcased a robust EBITDA growth, peaking in 2021 with a 300% increase from its 2014 figures. Despite a slight dip in 2022, the company rebounded in 2023, maintaining a strong financial position. Meanwhile, Waste Connections, a key player in waste management, demonstrated consistent growth, with its EBITDA nearly tripling over the decade. By 2023, Waste Connections had closed the gap significantly, reflecting its strategic expansions and operational efficiencies.
This comparative analysis highlights the dynamic nature of these industries and underscores the importance of strategic financial management.
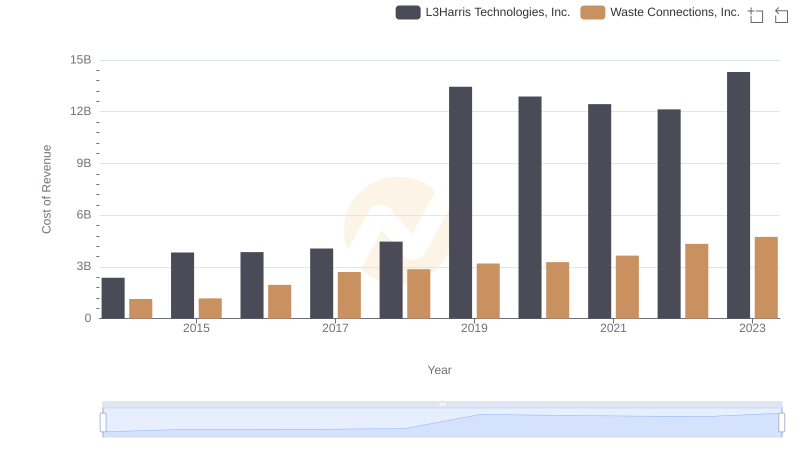
Cost of Revenue: Key Insights for Waste Connections, Inc. and L3Harris Technologies, Inc.

Key Insights on Gross Profit: Waste Connections, Inc. vs L3Harris Technologies, Inc.
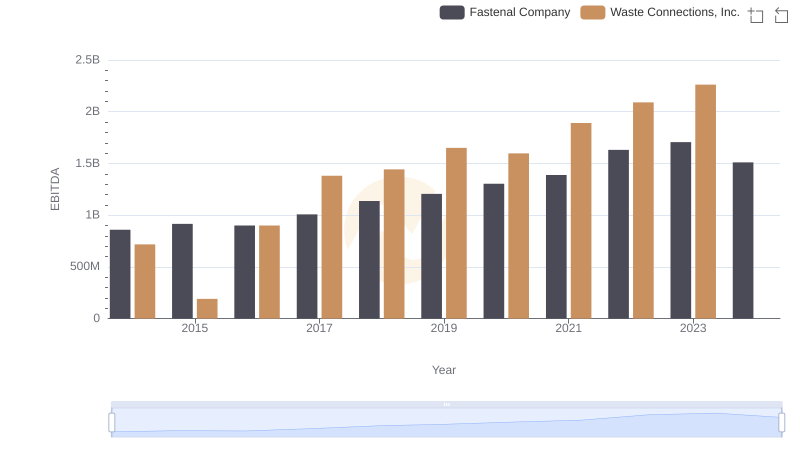
EBITDA Performance Review: Waste Connections, Inc. vs Fastenal Company

EBITDA Metrics Evaluated: Waste Connections, Inc. vs Quanta Services, Inc.

EBITDA Metrics Evaluated: Waste Connections, Inc. vs Ferguson plc

EBITDA Metrics Evaluated: Waste Connections, Inc. vs Old Dominion Freight Line, Inc.
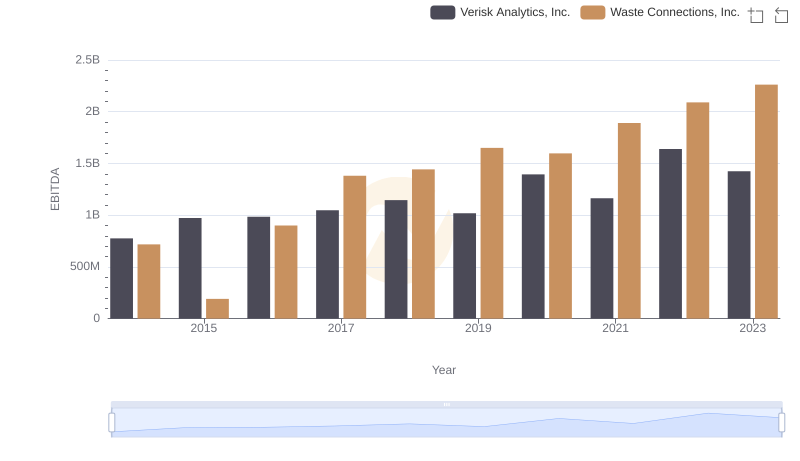
EBITDA Performance Review: Waste Connections, Inc. vs Verisk Analytics, Inc.
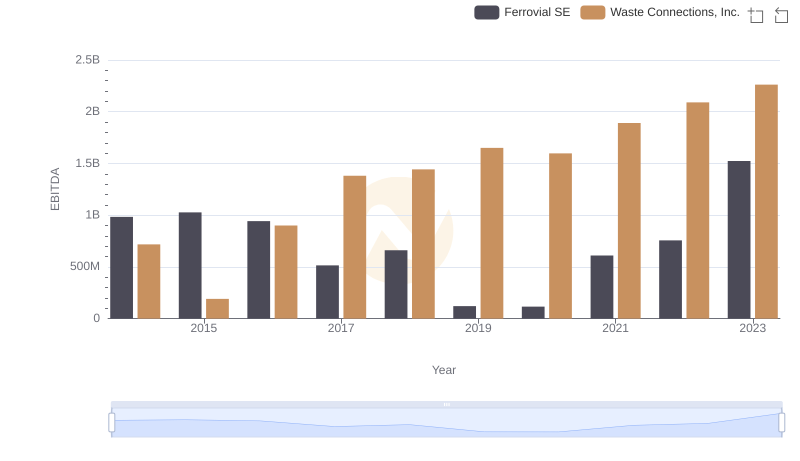
EBITDA Performance Review: Waste Connections, Inc. vs Ferrovial SE
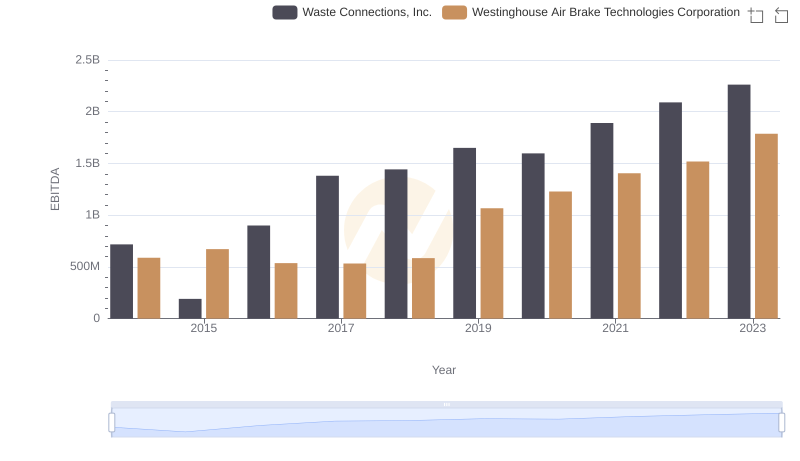
EBITDA Performance Review: Waste Connections, Inc. vs Westinghouse Air Brake Technologies Corporation