| __timestamp | Quanta Services, Inc. | Waste Connections, Inc. |
|---|---|---|
| Wednesday, January 1, 2014 | 1233520000 | 940778000 |
| Thursday, January 1, 2015 | 923665000 | 939878000 |
| Friday, January 1, 2016 | 1013800000 | 1418151000 |
| Sunday, January 1, 2017 | 1241860000 | 1925713000 |
| Monday, January 1, 2018 | 1479964000 | 2057237000 |
| Tuesday, January 1, 2019 | 1600252000 | 2189922000 |
| Wednesday, January 1, 2020 | 1660847000 | 2169182000 |
| Friday, January 1, 2021 | 1953259000 | 2497287000 |
| Saturday, January 1, 2022 | 2529155000 | 2875847000 |
| Sunday, January 1, 2023 | 2937086000 | 3277438000 |
| Monday, January 1, 2024 | 3727885000 |
Infusing magic into the data realm
In the ever-evolving landscape of the waste management and infrastructure sectors, Waste Connections, Inc. and Quanta Services, Inc. have emerged as formidable players. Over the past decade, from 2014 to 2023, these companies have demonstrated impressive growth in gross profit, reflecting their strategic prowess and market adaptability.
Waste Connections, Inc. has seen its gross profit soar by approximately 248%, starting from a modest base in 2014. Meanwhile, Quanta Services, Inc. has not lagged far behind, with a remarkable 138% increase over the same period. This growth trajectory underscores the resilience and innovation driving these companies forward.
As we delve into the numbers, it's evident that both companies have capitalized on industry trends and economic shifts, positioning themselves as leaders in their respective fields. This comparison offers valuable insights into the dynamics of profitability and market leadership in the modern business environment.
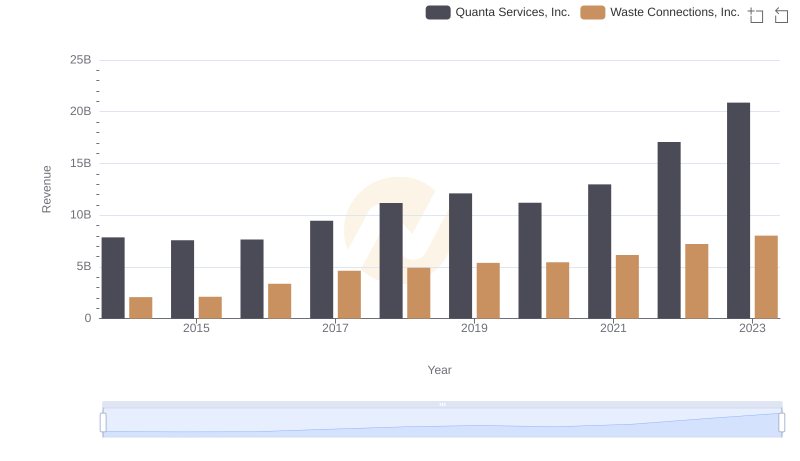
Comparing Revenue Performance: Waste Connections, Inc. or Quanta Services, Inc.?
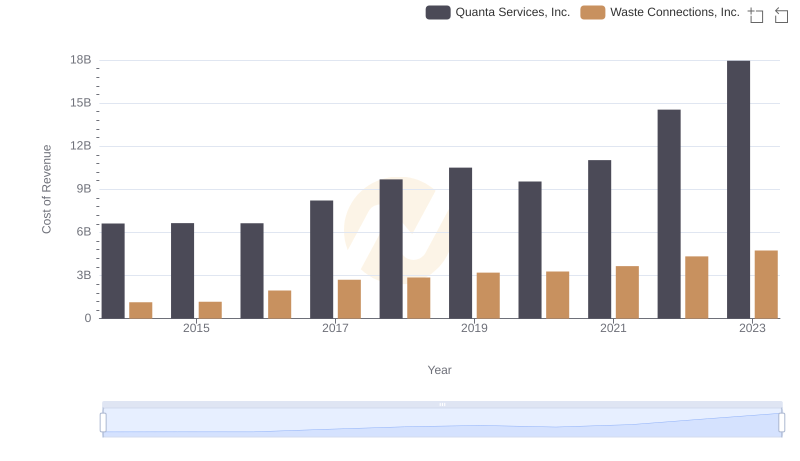
Cost of Revenue: Key Insights for Waste Connections, Inc. and Quanta Services, Inc.
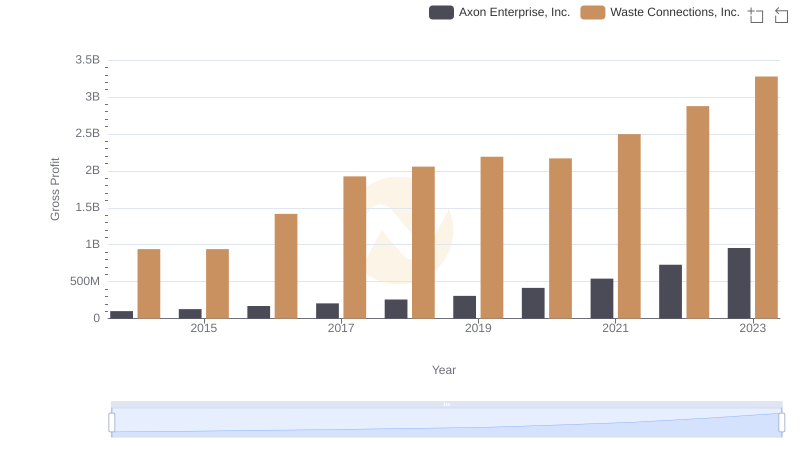
Who Generates Higher Gross Profit? Waste Connections, Inc. or Axon Enterprise, Inc.

Who Generates Higher Gross Profit? Waste Connections, Inc. or Fastenal Company
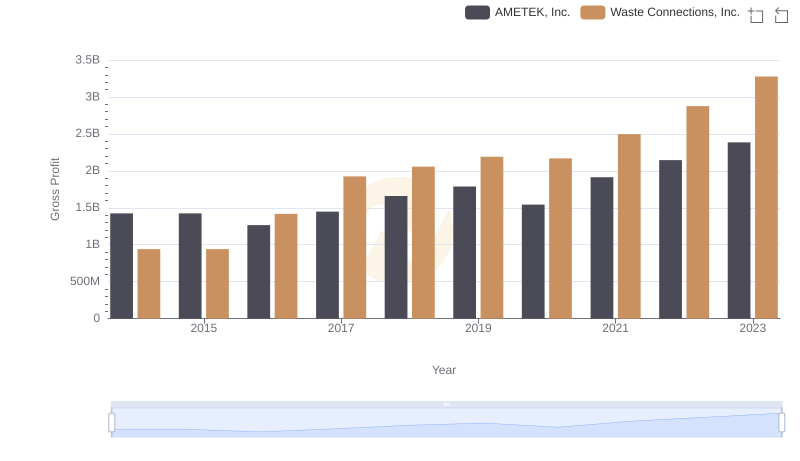
Waste Connections, Inc. vs AMETEK, Inc.: A Gross Profit Performance Breakdown

Key Insights on Gross Profit: Waste Connections, Inc. vs L3Harris Technologies, Inc.
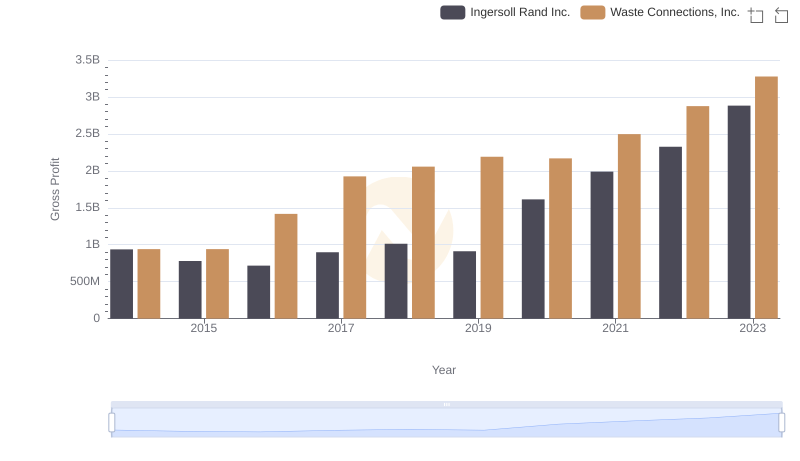
Waste Connections, Inc. vs Ingersoll Rand Inc.: A Gross Profit Performance Breakdown
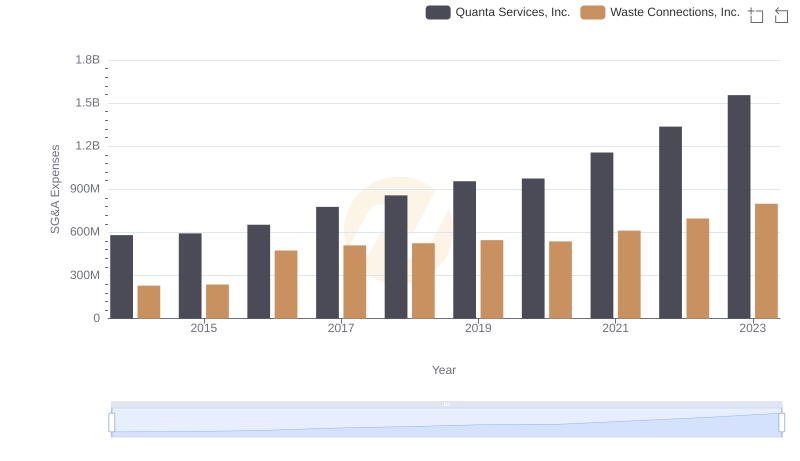
Waste Connections, Inc. vs Quanta Services, Inc.: SG&A Expense Trends

EBITDA Metrics Evaluated: Waste Connections, Inc. vs Quanta Services, Inc.