| __timestamp | Waste Connections, Inc. | Westinghouse Air Brake Technologies Corporation |
|---|---|---|
| Wednesday, January 1, 2014 | 717805000 | 588370000 |
| Thursday, January 1, 2015 | 191002871 | 672301000 |
| Friday, January 1, 2016 | 900371894 | 535893000 |
| Sunday, January 1, 2017 | 1380632000 | 532795000 |
| Monday, January 1, 2018 | 1442229014 | 584199000 |
| Tuesday, January 1, 2019 | 1650754605 | 1067300000 |
| Wednesday, January 1, 2020 | 1597555000 | 1229400000 |
| Friday, January 1, 2021 | 1891001000 | 1405000000 |
| Saturday, January 1, 2022 | 2090554149 | 1519000000 |
| Sunday, January 1, 2023 | 2261354000 | 1787000000 |
| Monday, January 1, 2024 | 2389779000 | 1609000000 |
Unleashing insights
In the ever-evolving landscape of industrial giants, Waste Connections, Inc. and Westinghouse Air Brake Technologies Corporation have showcased intriguing EBITDA trends over the past decade. From 2014 to 2023, Waste Connections, Inc. has consistently outperformed its counterpart, with a remarkable 215% increase in EBITDA, peaking at approximately $2.26 billion in 2023. In contrast, Westinghouse Air Brake Technologies Corporation demonstrated a steady growth trajectory, achieving a 204% rise, culminating in an EBITDA of around $1.79 billion in the same year.
This analysis highlights the resilience and strategic prowess of Waste Connections, Inc., which maintained a higher EBITDA margin throughout the period. As the industrial sector continues to adapt to global challenges, these companies exemplify robust financial health and strategic foresight, making them key players to watch in the coming years.

EBITDA Metrics Evaluated: Waste Connections, Inc. vs Ferguson plc

EBITDA Metrics Evaluated: Waste Connections, Inc. vs Old Dominion Freight Line, Inc.
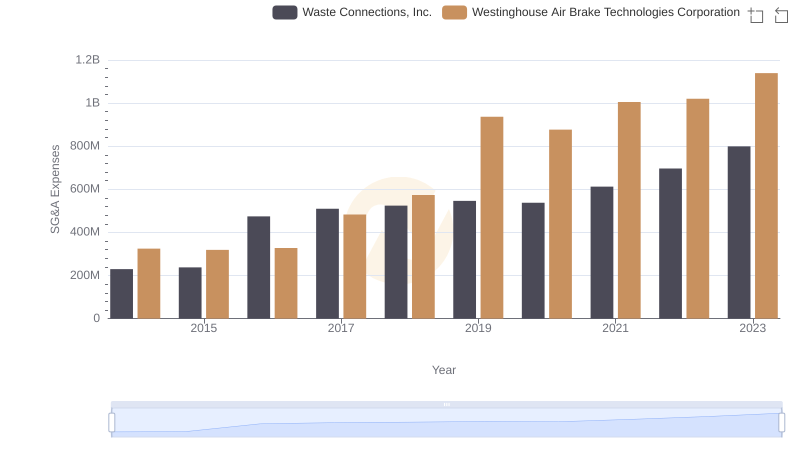
Cost Management Insights: SG&A Expenses for Waste Connections, Inc. and Westinghouse Air Brake Technologies Corporation
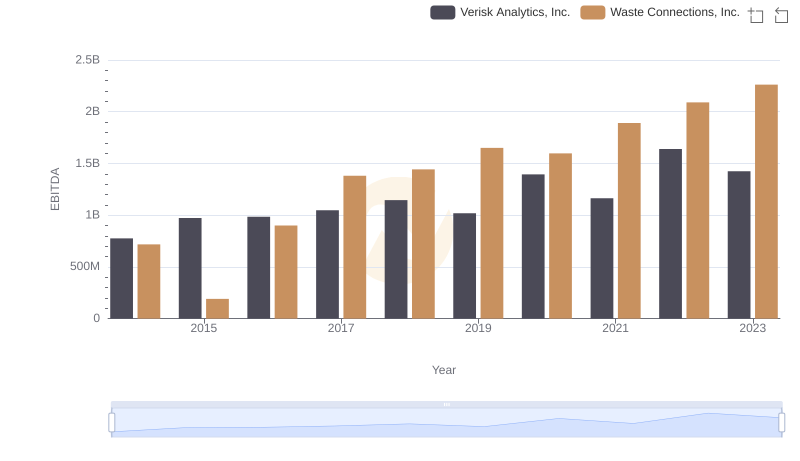
EBITDA Performance Review: Waste Connections, Inc. vs Verisk Analytics, Inc.
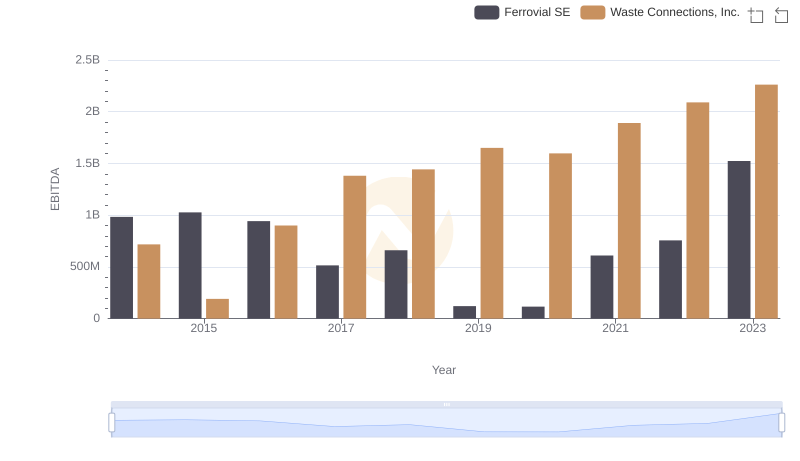
EBITDA Performance Review: Waste Connections, Inc. vs Ferrovial SE
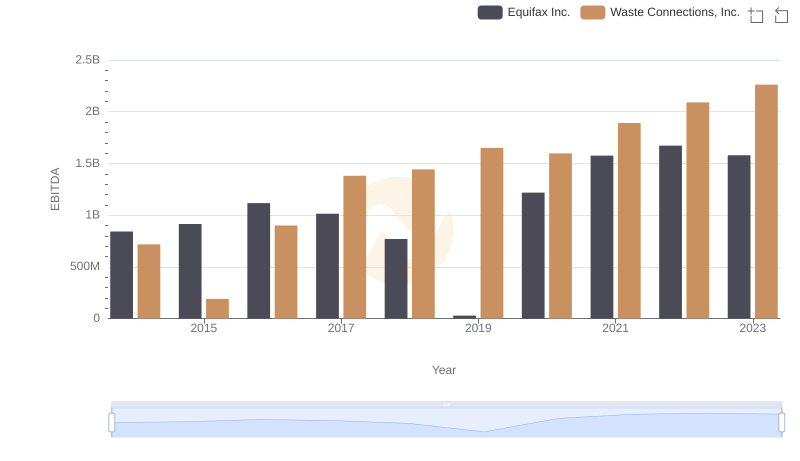
Professional EBITDA Benchmarking: Waste Connections, Inc. vs Equifax Inc.
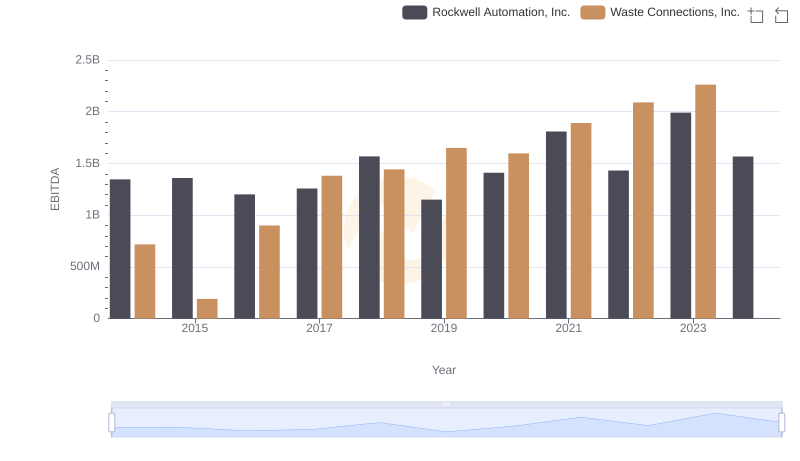
EBITDA Performance Review: Waste Connections, Inc. vs Rockwell Automation, Inc.
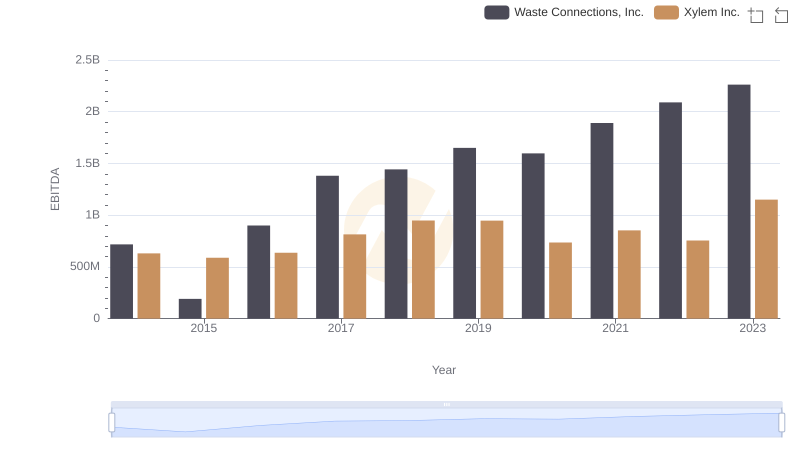
Comprehensive EBITDA Comparison: Waste Connections, Inc. vs Xylem Inc.