| __timestamp | Fastenal Company | Waste Connections, Inc. |
|---|---|---|
| Wednesday, January 1, 2014 | 859298000 | 717805000 |
| Thursday, January 1, 2015 | 915726000 | 191002871 |
| Friday, January 1, 2016 | 900285000 | 900371894 |
| Sunday, January 1, 2017 | 1008200000 | 1380632000 |
| Monday, January 1, 2018 | 1136900000 | 1442229014 |
| Tuesday, January 1, 2019 | 1205900000 | 1650754605 |
| Wednesday, January 1, 2020 | 1304200000 | 1597555000 |
| Friday, January 1, 2021 | 1388200000 | 1891001000 |
| Saturday, January 1, 2022 | 1630900000 | 2090554149 |
| Sunday, January 1, 2023 | 1706000000 | 2261354000 |
| Monday, January 1, 2024 | 1510000000 | 2389779000 |
Igniting the spark of knowledge
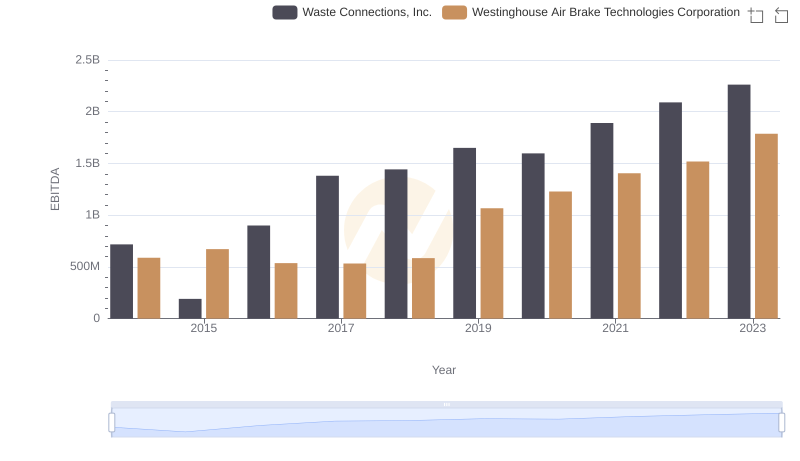
In the competitive landscape of industrial services, Waste Connections, Inc. and Fastenal Company have shown remarkable EBITDA growth over the past decade. From 2014 to 2023, Waste Connections, Inc. has seen its EBITDA soar by approximately 215%, reaching a peak in 2023. Fastenal Company, not far behind, experienced a robust 99% increase in the same period.
Waste Connections, Inc. started with a modest EBITDA in 2014, but by 2023, it had more than tripled, showcasing its strategic prowess in waste management. Fastenal Company, a leader in industrial supplies, also demonstrated consistent growth, nearly doubling its EBITDA by 2023.
While 2024 data for Waste Connections, Inc. remains unavailable, Fastenal Company shows a slight dip, indicating potential market challenges. As these giants continue to evolve, their financial trajectories will be closely watched by investors and industry analysts alike.
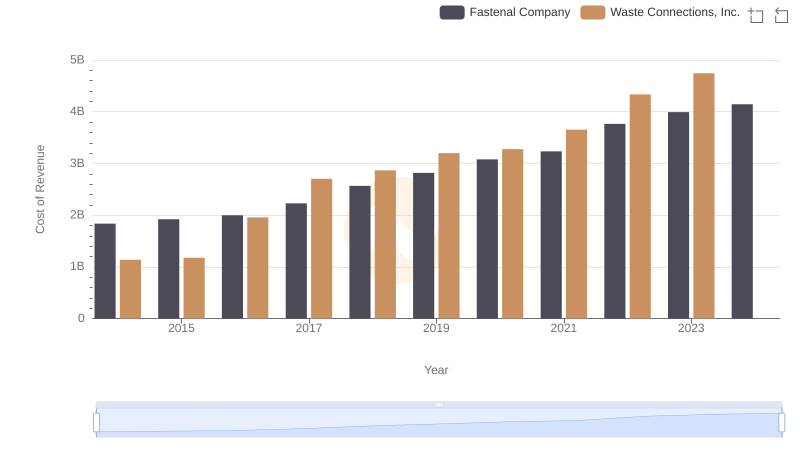
Comparing Cost of Revenue Efficiency: Waste Connections, Inc. vs Fastenal Company

Who Generates Higher Gross Profit? Waste Connections, Inc. or Fastenal Company
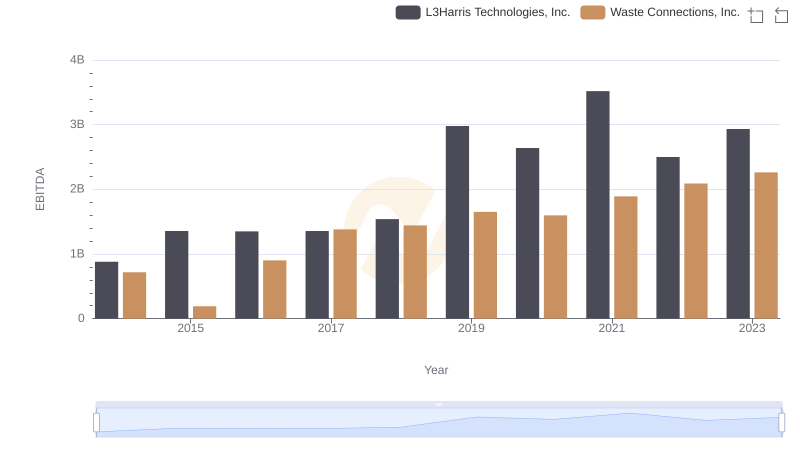
EBITDA Metrics Evaluated: Waste Connections, Inc. vs L3Harris Technologies, Inc.

EBITDA Metrics Evaluated: Waste Connections, Inc. vs Quanta Services, Inc.

EBITDA Metrics Evaluated: Waste Connections, Inc. vs Ferguson plc

EBITDA Metrics Evaluated: Waste Connections, Inc. vs Old Dominion Freight Line, Inc.
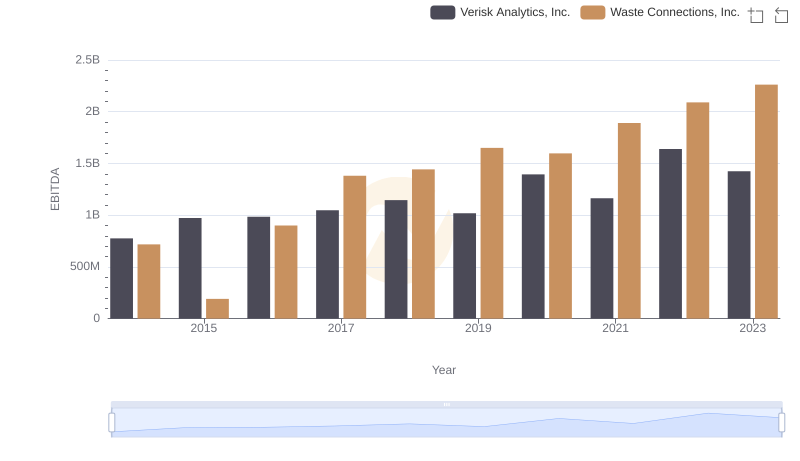
EBITDA Performance Review: Waste Connections, Inc. vs Verisk Analytics, Inc.
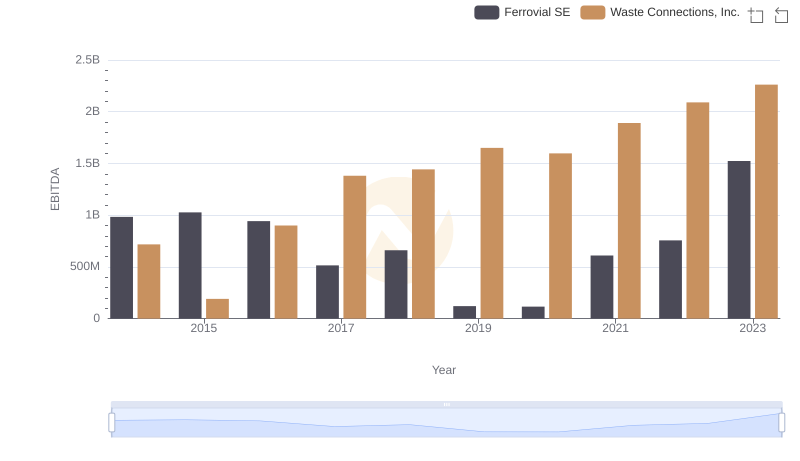
EBITDA Performance Review: Waste Connections, Inc. vs Ferrovial SE
EBITDA Performance Review: Waste Connections, Inc. vs Westinghouse Air Brake Technologies Corporation