| __timestamp | Cisco Systems, Inc. | HP Inc. |
|---|---|---|
| Wednesday, January 1, 2014 | 12709000000 | 8766000000 |
| Thursday, January 1, 2015 | 14209000000 | 7760000000 |
| Friday, January 1, 2016 | 15678000000 | 4272000000 |
| Sunday, January 1, 2017 | 15383000000 | 4359000000 |
| Monday, January 1, 2018 | 16172000000 | 4847000000 |
| Tuesday, January 1, 2019 | 17334000000 | 3504000000 |
| Wednesday, January 1, 2020 | 16363000000 | 4256000000 |
| Friday, January 1, 2021 | 15558000000 | 8603000000 |
| Saturday, January 1, 2022 | 16794000000 | 5453000000 |
| Sunday, January 1, 2023 | 17471000000 | 4462000000 |
| Monday, January 1, 2024 | 15747000000 | 4716000000 |
Igniting the spark of knowledge
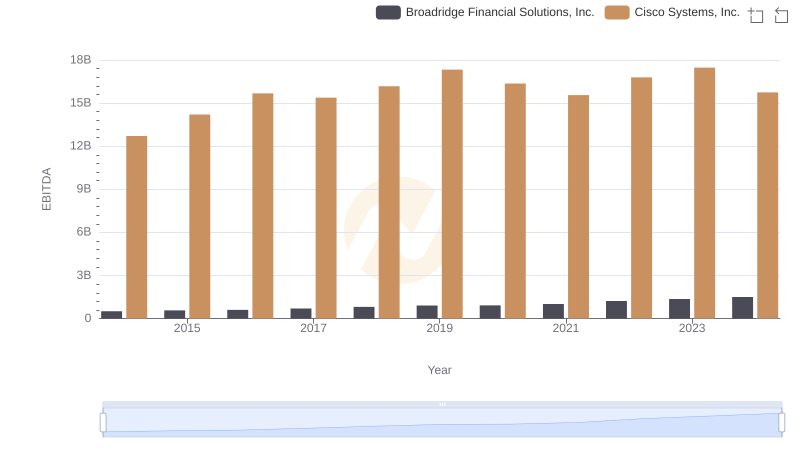
In the ever-evolving landscape of technology giants, Cisco Systems, Inc. and HP Inc. have long been at the forefront of innovation and financial prowess. This analysis delves into their EBITDA performance from 2014 to 2024, offering a glimpse into their financial health and strategic maneuvers over the past decade.
Cisco Systems, Inc. has consistently outperformed HP Inc., with an average EBITDA nearly three times higher. Notably, Cisco's EBITDA peaked in 2023, showcasing a robust 37% increase from its 2014 figures. In contrast, HP Inc. experienced a more volatile journey, with its EBITDA fluctuating significantly, peaking in 2014 and then witnessing a 49% decline by 2023.
This financial narrative underscores Cisco's steady growth and resilience, while HP Inc.'s journey reflects the challenges and opportunities in adapting to market dynamics. As we look to the future, these insights provide valuable lessons for investors and industry watchers alike.
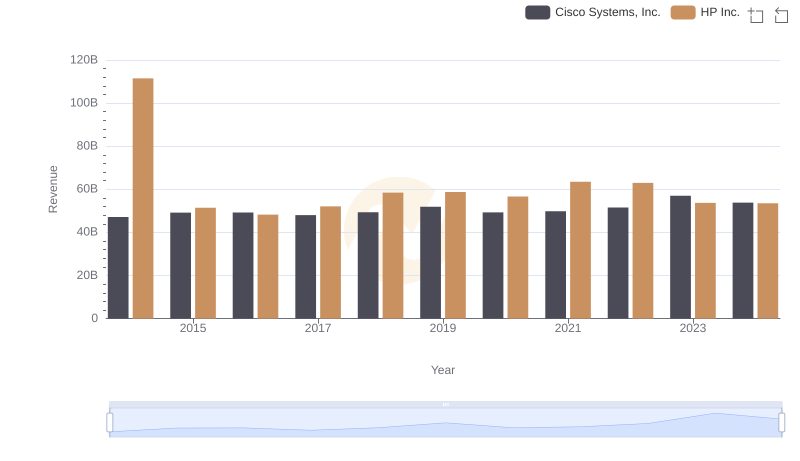
Cisco Systems, Inc. and HP Inc.: A Comprehensive Revenue Analysis
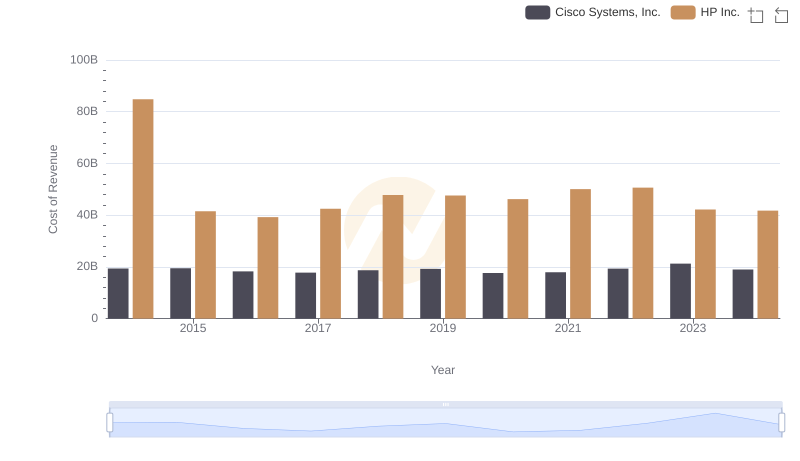
Cost of Revenue: Key Insights for Cisco Systems, Inc. and HP Inc.

Gross Profit Analysis: Comparing Cisco Systems, Inc. and HP Inc.
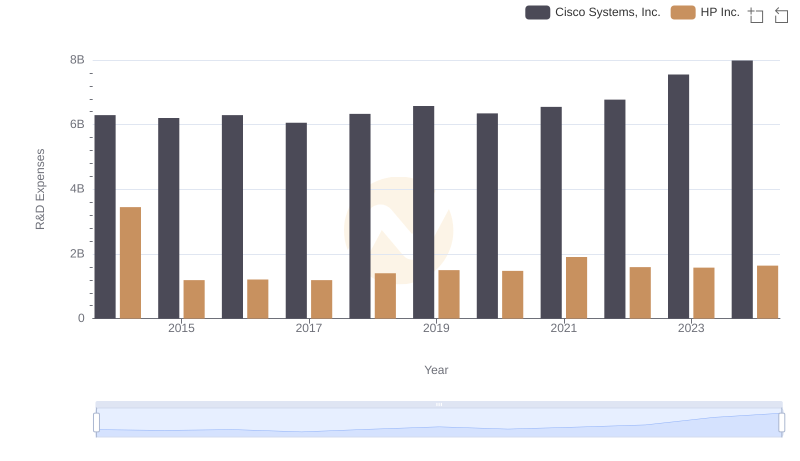
Who Prioritizes Innovation? R&D Spending Compared for Cisco Systems, Inc. and HP Inc.
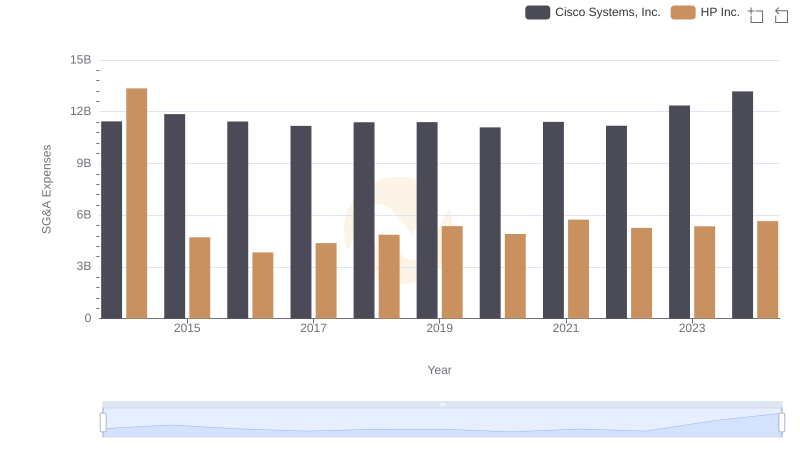
Breaking Down SG&A Expenses: Cisco Systems, Inc. vs HP Inc.
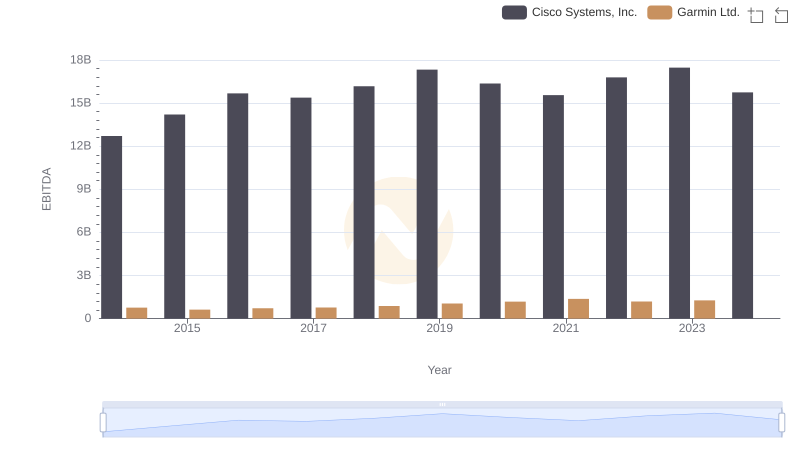
A Side-by-Side Analysis of EBITDA: Cisco Systems, Inc. and Garmin Ltd.

Cisco Systems, Inc. and Wipro Limited: A Detailed Examination of EBITDA Performance
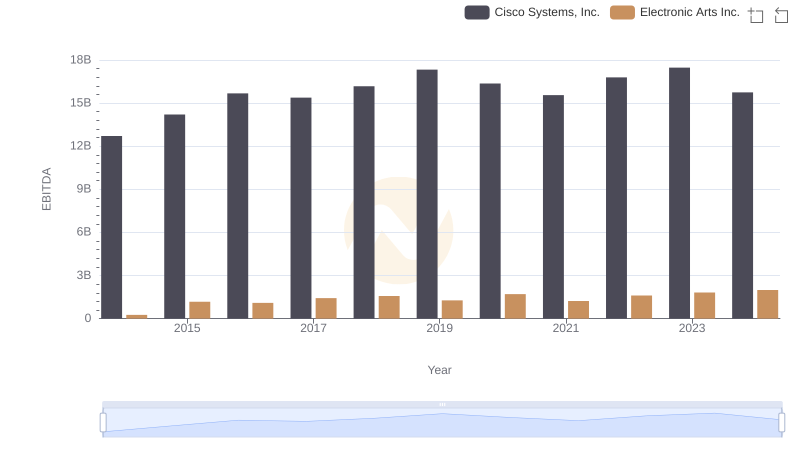
Professional EBITDA Benchmarking: Cisco Systems, Inc. vs Electronic Arts Inc.

EBITDA Metrics Evaluated: Cisco Systems, Inc. vs Corpay, Inc.
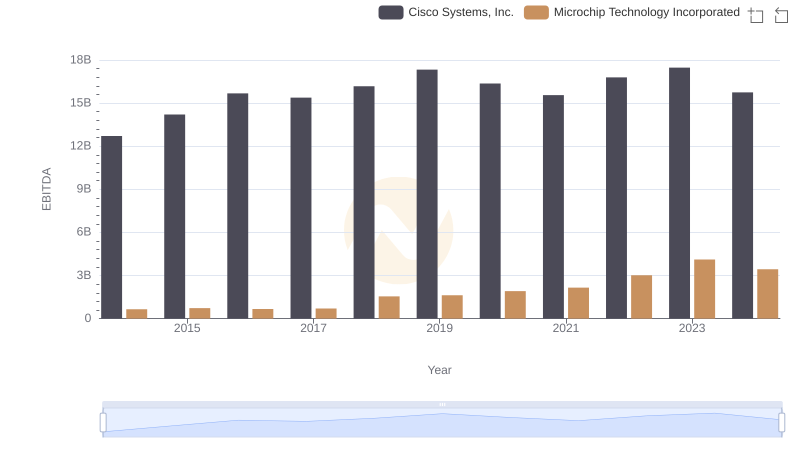
A Side-by-Side Analysis of EBITDA: Cisco Systems, Inc. and Microchip Technology Incorporated
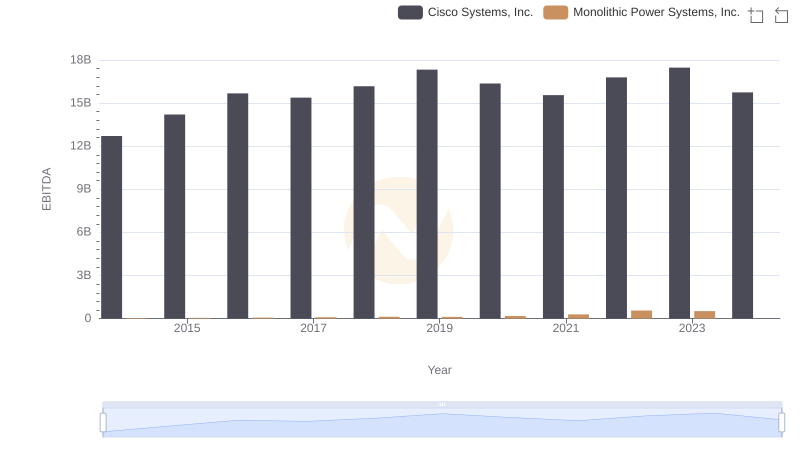
EBITDA Metrics Evaluated: Cisco Systems, Inc. vs Monolithic Power Systems, Inc.
EBITDA Metrics Evaluated: Cisco Systems, Inc. vs Broadridge Financial Solutions, Inc.