| __timestamp | Broadridge Financial Solutions, Inc. | Cisco Systems, Inc. |
|---|---|---|
| Wednesday, January 1, 2014 | 376000000 | 11437000000 |
| Thursday, January 1, 2015 | 396800000 | 11861000000 |
| Friday, January 1, 2016 | 420900000 | 11433000000 |
| Sunday, January 1, 2017 | 501400000 | 11177000000 |
| Monday, January 1, 2018 | 565400000 | 11386000000 |
| Tuesday, January 1, 2019 | 577500000 | 11398000000 |
| Wednesday, January 1, 2020 | 639000000 | 11094000000 |
| Friday, January 1, 2021 | 744300000 | 11411000000 |
| Saturday, January 1, 2022 | 832300000 | 11186000000 |
| Sunday, January 1, 2023 | 849000000 | 12358000000 |
| Monday, January 1, 2024 | 916800000 | 13177000000 |
Igniting the spark of knowledge
In the ever-evolving landscape of technology and financial services, understanding the financial health of industry giants is crucial. This analysis delves into the Selling, General, and Administrative (SG&A) expenses of Cisco Systems, Inc. and Broadridge Financial Solutions, Inc. over the past decade.
From 2014 to 2024, Cisco's SG&A expenses have shown a steady increase, peaking at approximately $13.2 billion in 2024, marking a 15% rise from 2014. In contrast, Broadridge's expenses have surged by over 140% during the same period, reaching around $916 million in 2024. This stark difference highlights Cisco's expansive operational scale compared to Broadridge's rapid growth trajectory.
These insights provide a window into the strategic priorities of these companies, with Cisco focusing on maintaining its market dominance and Broadridge investing heavily in growth and expansion.
Cisco's consistent SG&A expenses reflect stability, while Broadridge's growth underscores its aggressive expansion strategy.
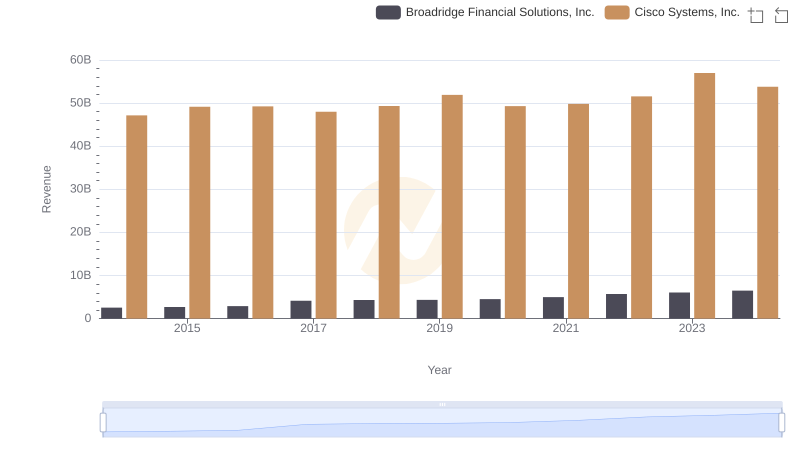
Cisco Systems, Inc. or Broadridge Financial Solutions, Inc.: Who Leads in Yearly Revenue?
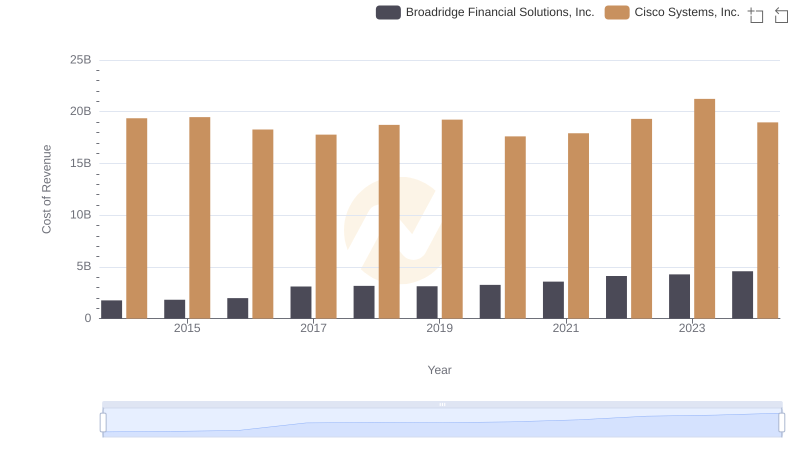
Analyzing Cost of Revenue: Cisco Systems, Inc. and Broadridge Financial Solutions, Inc.
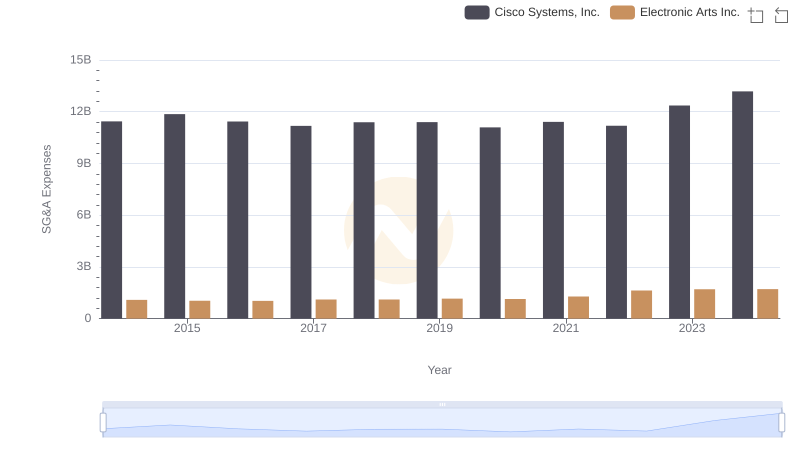
Who Optimizes SG&A Costs Better? Cisco Systems, Inc. or Electronic Arts Inc.
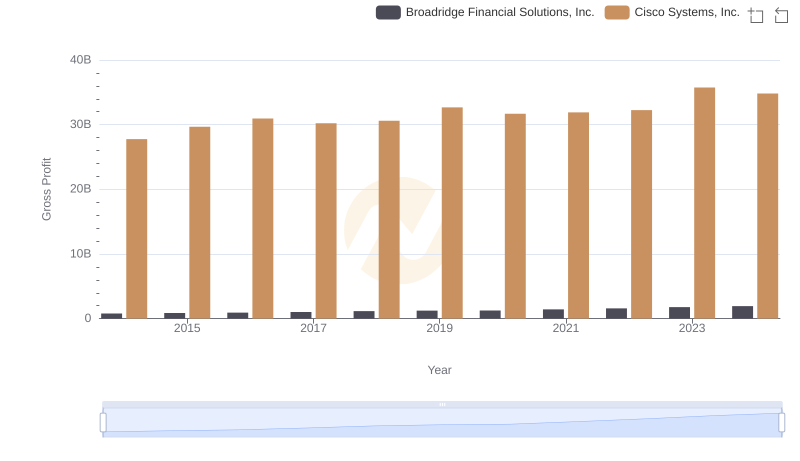
Gross Profit Comparison: Cisco Systems, Inc. and Broadridge Financial Solutions, Inc. Trends
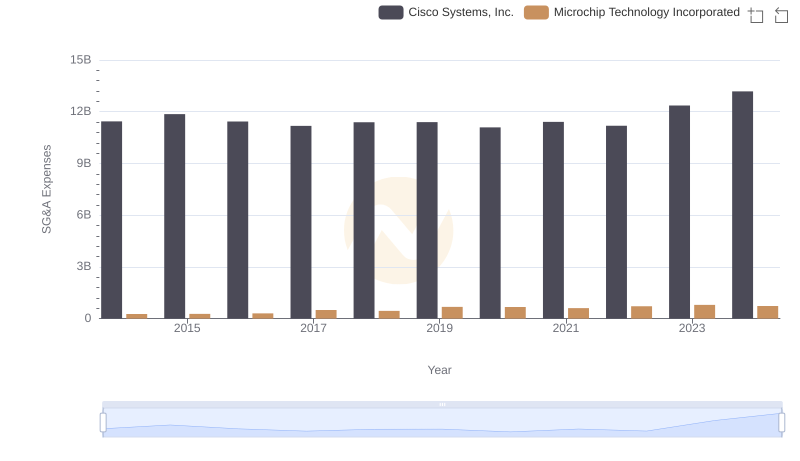
Selling, General, and Administrative Costs: Cisco Systems, Inc. vs Microchip Technology Incorporated
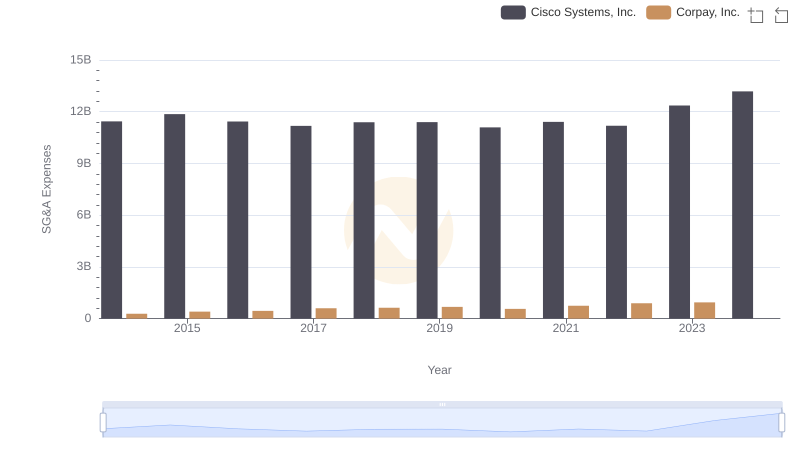
Cisco Systems, Inc. and Corpay, Inc.: SG&A Spending Patterns Compared
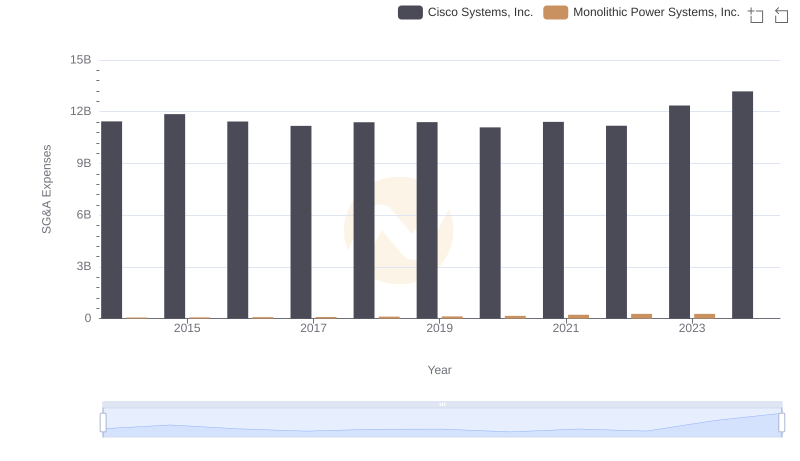
Breaking Down SG&A Expenses: Cisco Systems, Inc. vs Monolithic Power Systems, Inc.
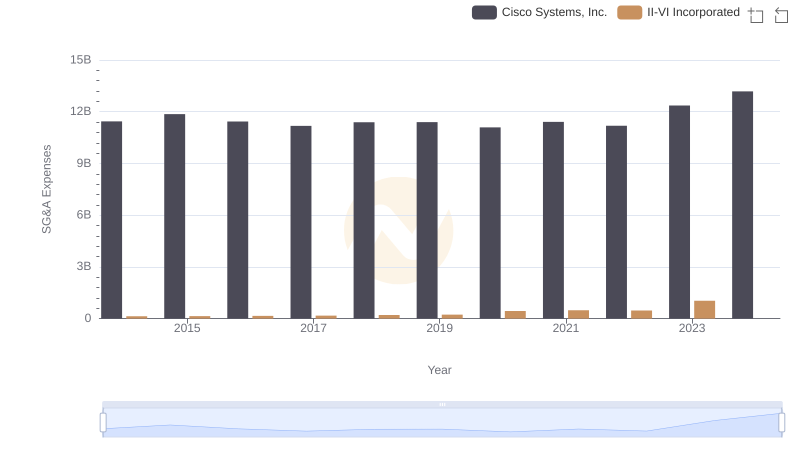
Operational Costs Compared: SG&A Analysis of Cisco Systems, Inc. and II-VI Incorporated
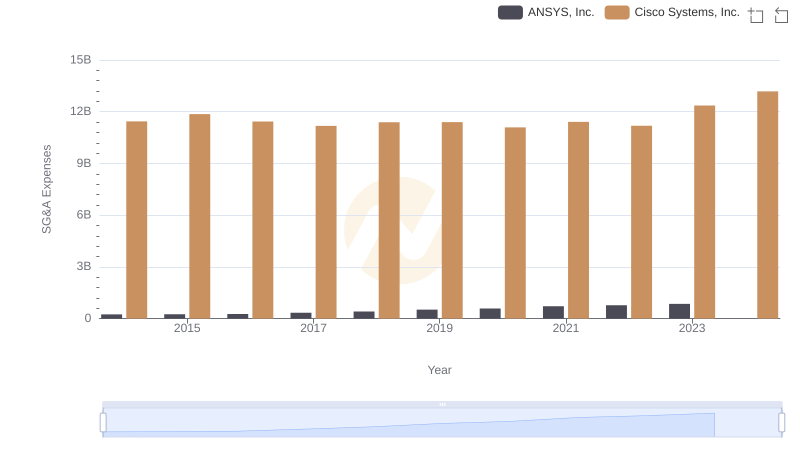
Cisco Systems, Inc. vs ANSYS, Inc.: SG&A Expense Trends
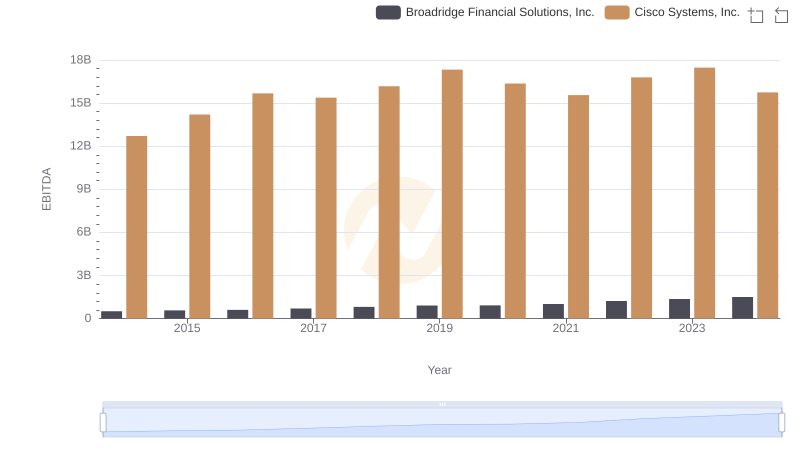
EBITDA Metrics Evaluated: Cisco Systems, Inc. vs Broadridge Financial Solutions, Inc.
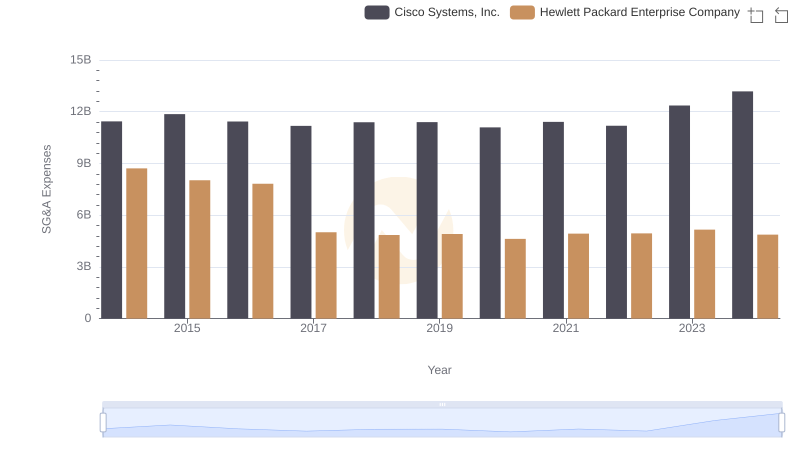
Comparing SG&A Expenses: Cisco Systems, Inc. vs Hewlett Packard Enterprise Company Trends and Insights
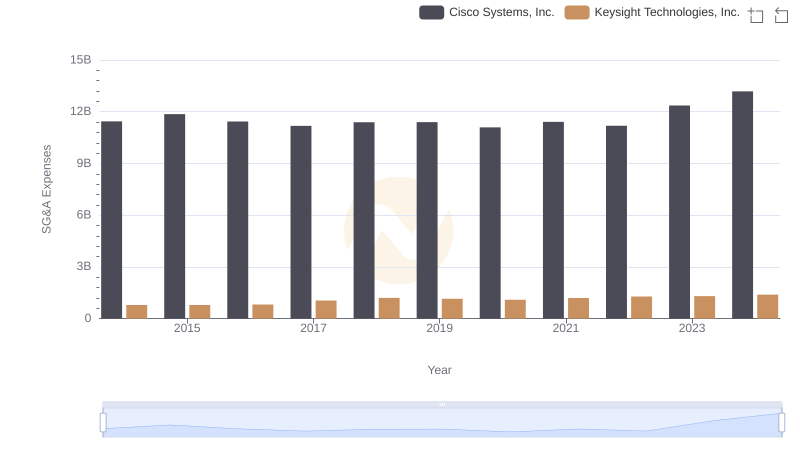
Cost Management Insights: SG&A Expenses for Cisco Systems, Inc. and Keysight Technologies, Inc.