| __timestamp | Carlisle Companies Incorporated | Cintas Corporation |
|---|---|---|
| Wednesday, January 1, 2014 | 512300000 | 793811000 |
| Thursday, January 1, 2015 | 631900000 | 877761000 |
| Friday, January 1, 2016 | 580200000 | 933728000 |
| Sunday, January 1, 2017 | 609300000 | 968293000 |
| Monday, January 1, 2018 | 696100000 | 1227852000 |
| Tuesday, January 1, 2019 | 851000000 | 1564228000 |
| Wednesday, January 1, 2020 | 733100000 | 1542737000 |
| Friday, January 1, 2021 | 816100000 | 1773591000 |
| Saturday, January 1, 2022 | 1483400000 | 1990046000 |
| Sunday, January 1, 2023 | 1210700000 | 2221676000 |
| Monday, January 1, 2024 | 1356800000 | 2523857000 |
Unleashing insights
In the ever-evolving landscape of corporate finance, understanding EBITDA trends is crucial for investors and analysts alike. This analysis delves into the EBITDA performance of Cintas Corporation and Carlisle Companies Incorporated from 2014 to 2023. Over this period, Cintas Corporation has consistently outperformed Carlisle Companies, showcasing a robust growth trajectory. By 2023, Cintas' EBITDA surged by approximately 180% from its 2014 levels, reaching over 2.2 billion, while Carlisle's EBITDA increased by about 136%, peaking at 1.48 billion in 2022 before a slight dip in 2023.
The data highlights Cintas' strategic prowess in maintaining a steady upward trend, even amidst economic fluctuations. Meanwhile, Carlisle's performance, though commendable, reflects more volatility. Notably, the data for 2024 is incomplete, leaving room for speculation on future trends. This analysis underscores the importance of strategic financial management in achieving sustained growth.
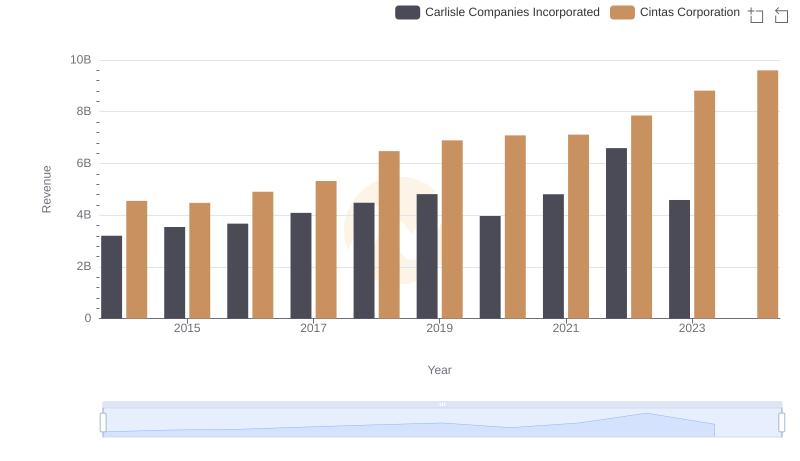
Cintas Corporation vs Carlisle Companies Incorporated: Annual Revenue Growth Compared
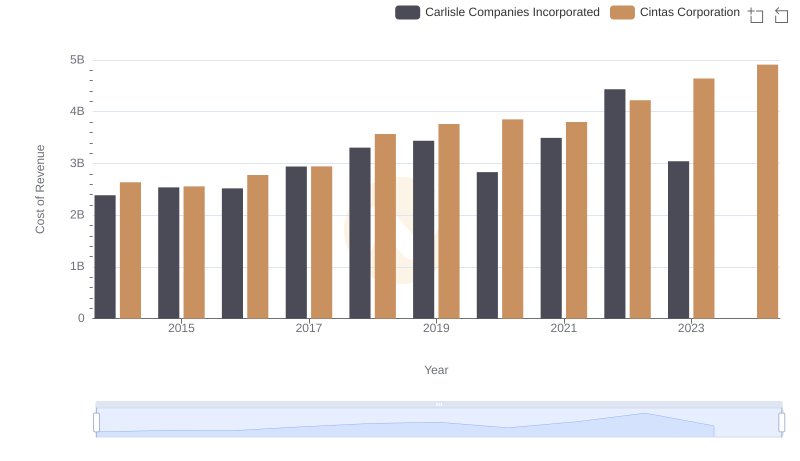
Cost of Revenue: Key Insights for Cintas Corporation and Carlisle Companies Incorporated
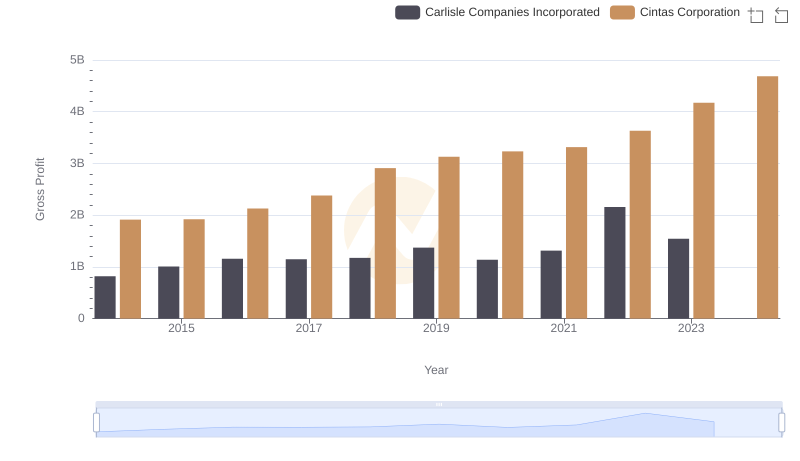
Gross Profit Comparison: Cintas Corporation and Carlisle Companies Incorporated Trends
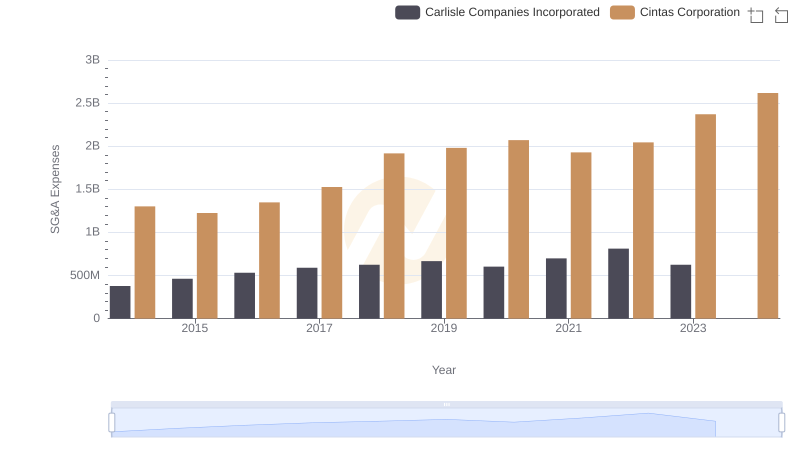
Who Optimizes SG&A Costs Better? Cintas Corporation or Carlisle Companies Incorporated
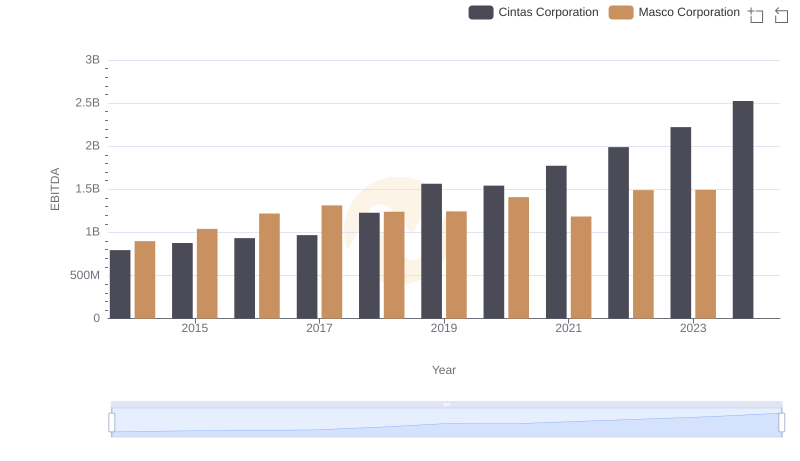
Cintas Corporation and Masco Corporation: A Detailed Examination of EBITDA Performance
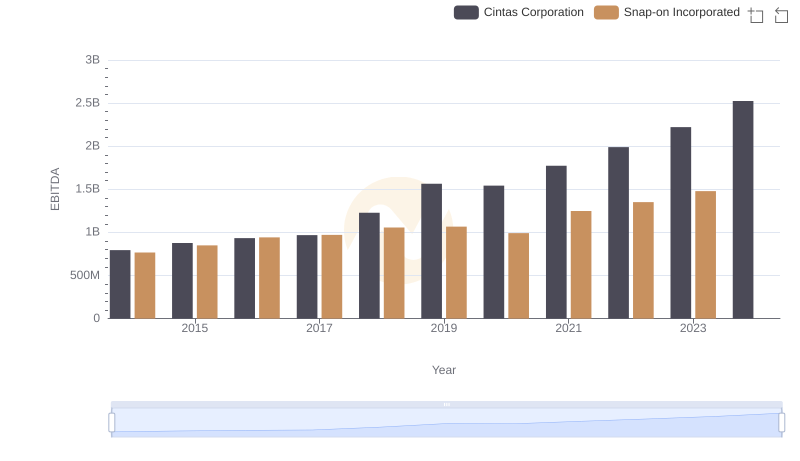
EBITDA Metrics Evaluated: Cintas Corporation vs Snap-on Incorporated
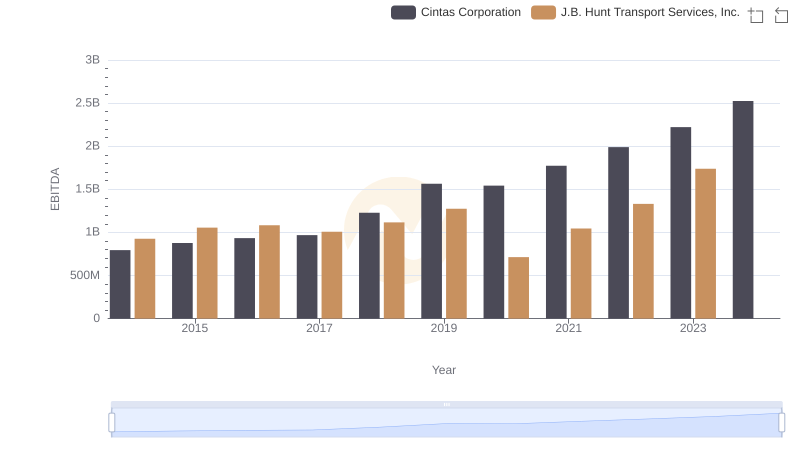
Comparative EBITDA Analysis: Cintas Corporation vs J.B. Hunt Transport Services, Inc.
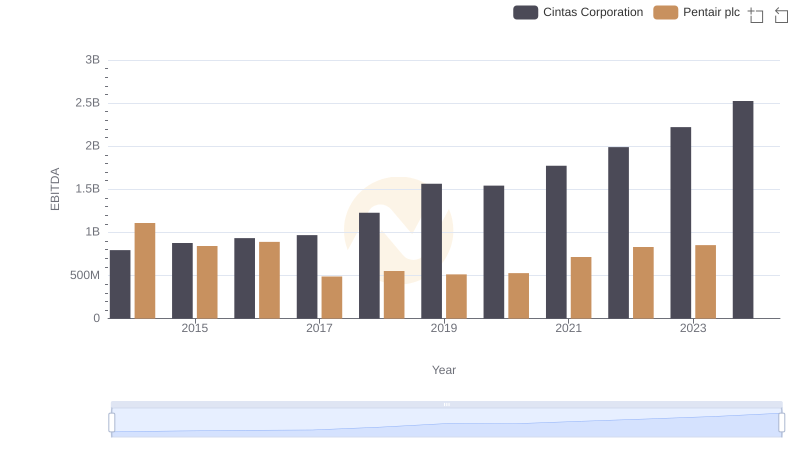
Professional EBITDA Benchmarking: Cintas Corporation vs Pentair plc
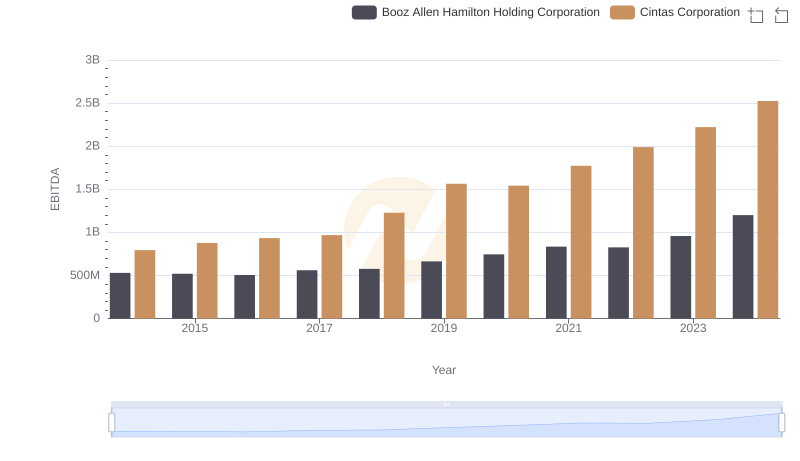
Cintas Corporation and Booz Allen Hamilton Holding Corporation: A Detailed Examination of EBITDA Performance
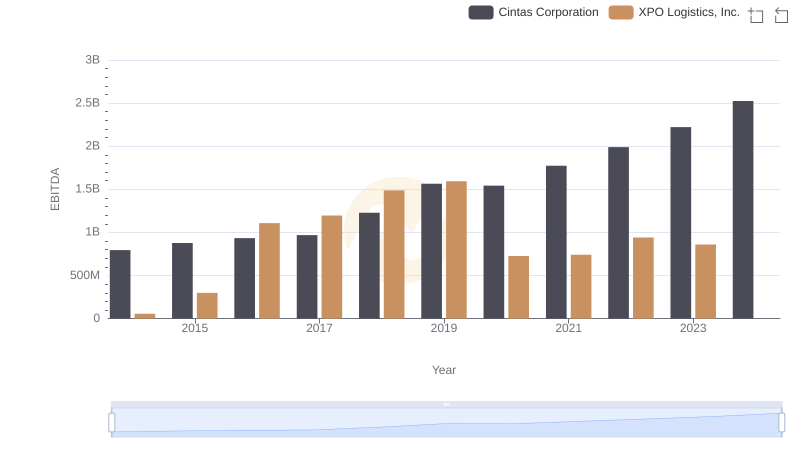
Cintas Corporation and XPO Logistics, Inc.: A Detailed Examination of EBITDA Performance
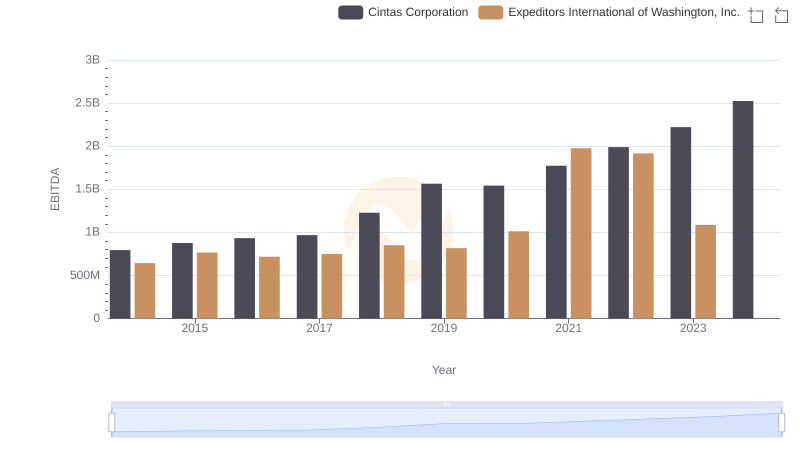
EBITDA Analysis: Evaluating Cintas Corporation Against Expeditors International of Washington, Inc.