| __timestamp | Booz Allen Hamilton Holding Corporation | Cintas Corporation |
|---|---|---|
| Wednesday, January 1, 2014 | 531144000 | 793811000 |
| Thursday, January 1, 2015 | 520410000 | 877761000 |
| Friday, January 1, 2016 | 506120000 | 933728000 |
| Sunday, January 1, 2017 | 561524000 | 968293000 |
| Monday, January 1, 2018 | 577061000 | 1227852000 |
| Tuesday, January 1, 2019 | 663731000 | 1564228000 |
| Wednesday, January 1, 2020 | 745424000 | 1542737000 |
| Friday, January 1, 2021 | 834449000 | 1773591000 |
| Saturday, January 1, 2022 | 826865000 | 1990046000 |
| Sunday, January 1, 2023 | 958150000 | 2221676000 |
| Monday, January 1, 2024 | 1199992000 | 2523857000 |
Data in motion
In the ever-evolving landscape of corporate finance, EBITDA (Earnings Before Interest, Taxes, Depreciation, and Amortization) serves as a crucial indicator of a company's operational performance. This analysis delves into the EBITDA trends of two industry giants: Cintas Corporation and Booz Allen Hamilton Holding Corporation, from 2014 to 2024.
Cintas Corporation has demonstrated a robust growth trajectory, with its EBITDA increasing by approximately 218% over the decade. This growth reflects Cintas's strategic expansion and operational efficiency. In contrast, Booz Allen Hamilton's EBITDA has grown by about 126%, showcasing steady performance in the consulting sector.
The data reveals that Cintas consistently outperformed Booz Allen Hamilton, with a notable surge in 2023, where Cintas's EBITDA was nearly double that of Booz Allen Hamilton. This trend underscores Cintas's resilience and adaptability in a competitive market.
As we look to the future, these insights provide valuable perspectives for investors and stakeholders seeking to understand the financial health and potential of these corporations.
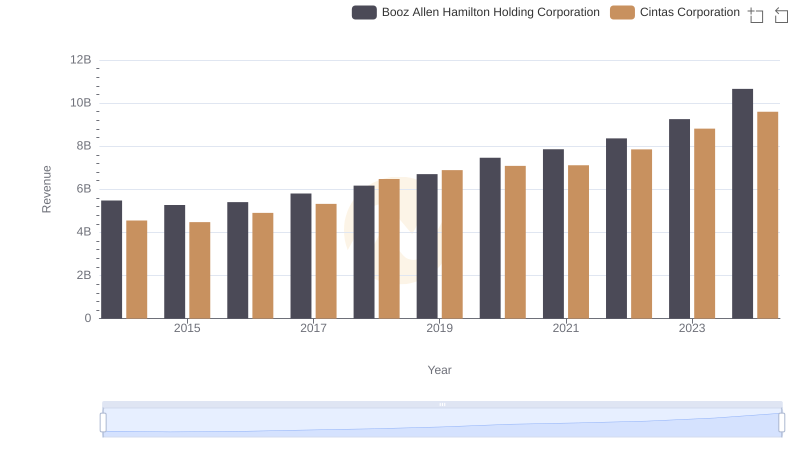
Cintas Corporation vs Booz Allen Hamilton Holding Corporation: Examining Key Revenue Metrics
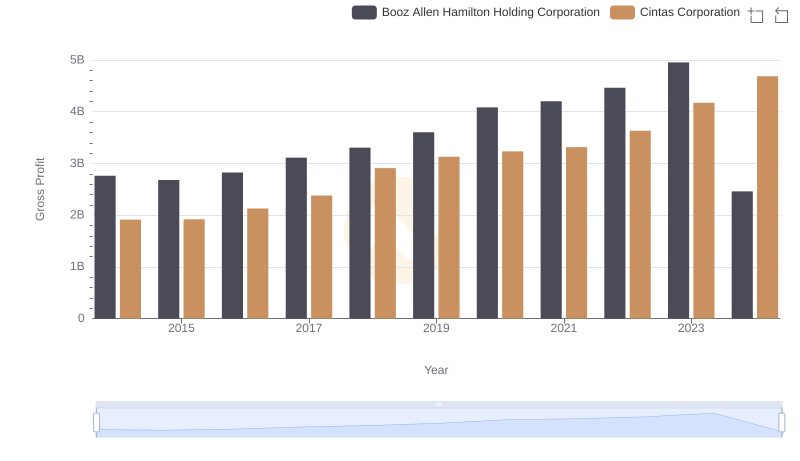
Cintas Corporation and Booz Allen Hamilton Holding Corporation: A Detailed Gross Profit Analysis
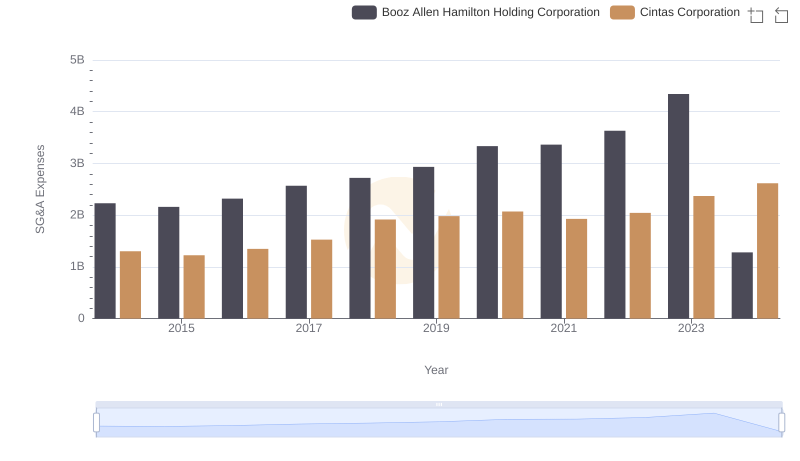
Cintas Corporation and Booz Allen Hamilton Holding Corporation: SG&A Spending Patterns Compared
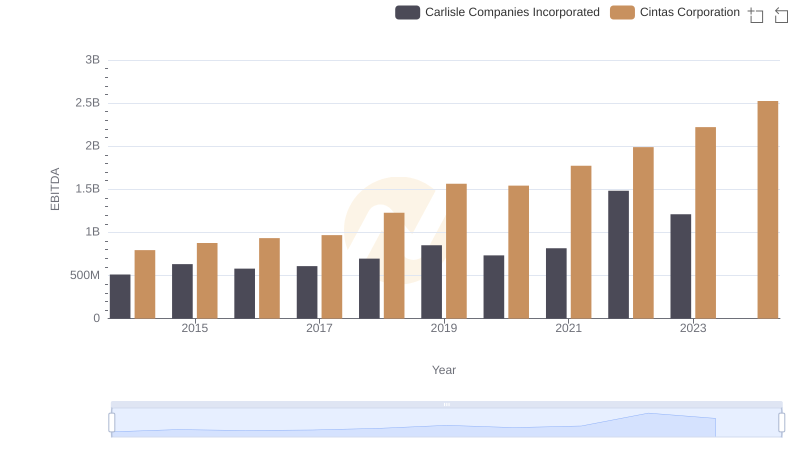
EBITDA Metrics Evaluated: Cintas Corporation vs Carlisle Companies Incorporated
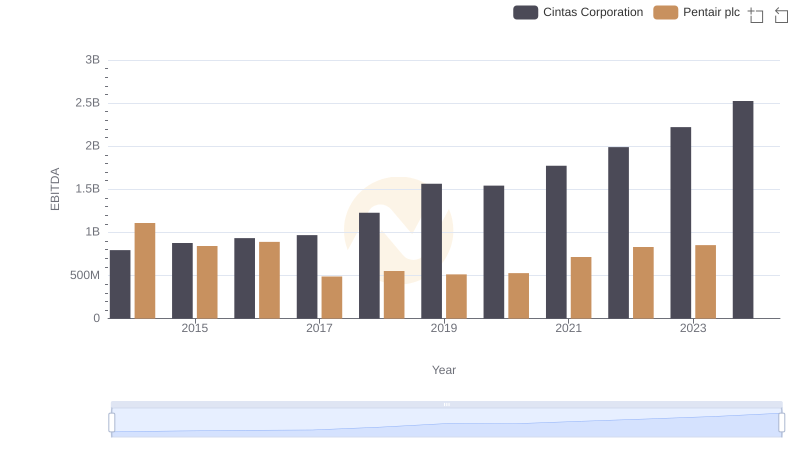
Professional EBITDA Benchmarking: Cintas Corporation vs Pentair plc
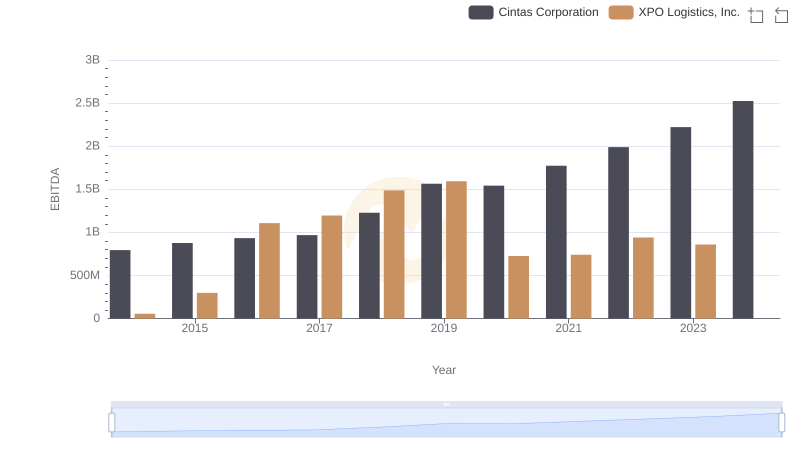
Cintas Corporation and XPO Logistics, Inc.: A Detailed Examination of EBITDA Performance
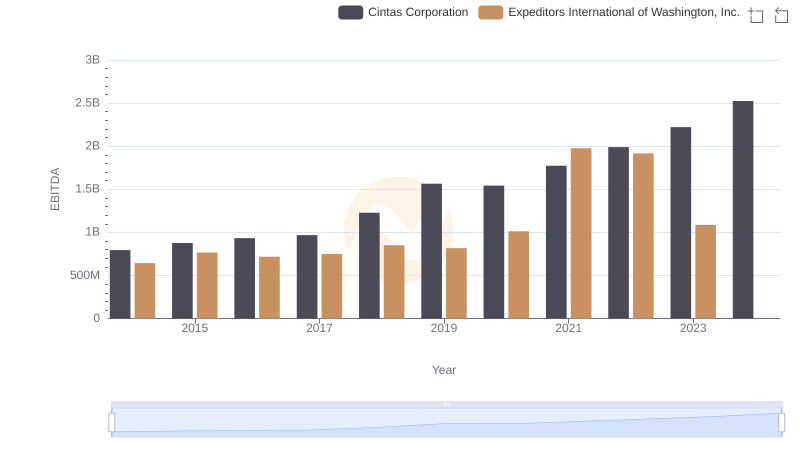
EBITDA Analysis: Evaluating Cintas Corporation Against Expeditors International of Washington, Inc.
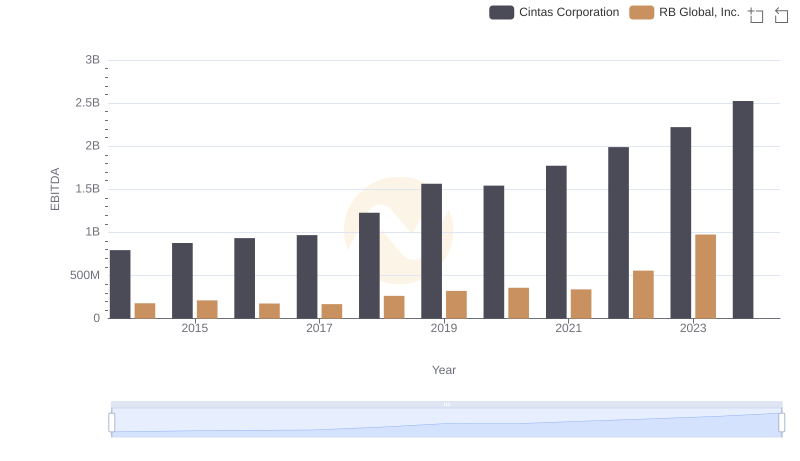
Cintas Corporation and RB Global, Inc.: A Detailed Examination of EBITDA Performance
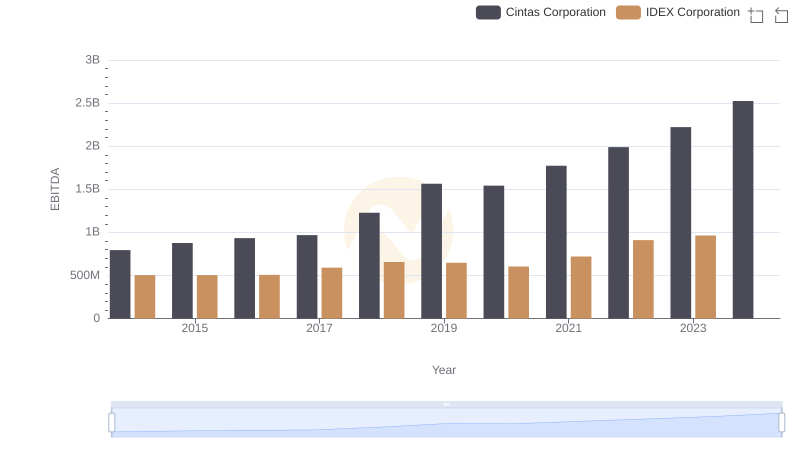
A Side-by-Side Analysis of EBITDA: Cintas Corporation and IDEX Corporation