| __timestamp | Cintas Corporation | XPO Logistics, Inc. |
|---|---|---|
| Wednesday, January 1, 2014 | 793811000 | 56600000 |
| Thursday, January 1, 2015 | 877761000 | 298000000 |
| Friday, January 1, 2016 | 933728000 | 1108300000 |
| Sunday, January 1, 2017 | 968293000 | 1196700000 |
| Monday, January 1, 2018 | 1227852000 | 1488000000 |
| Tuesday, January 1, 2019 | 1564228000 | 1594000000 |
| Wednesday, January 1, 2020 | 1542737000 | 727000000 |
| Friday, January 1, 2021 | 1773591000 | 741000000 |
| Saturday, January 1, 2022 | 1990046000 | 941000000 |
| Sunday, January 1, 2023 | 2221676000 | 860000000 |
| Monday, January 1, 2024 | 2523857000 | 1186000000 |
Infusing magic into the data realm
In the dynamic world of logistics and corporate services, understanding financial performance is crucial. Over the past decade, Cintas Corporation and XPO Logistics, Inc. have demonstrated intriguing trends in their EBITDA, a key indicator of financial health. From 2014 to 2023, Cintas Corporation's EBITDA surged by approximately 218%, reflecting robust growth and strategic business maneuvers. In contrast, XPO Logistics, Inc. experienced a more volatile journey, peaking in 2019 with a 1,594% increase from its 2014 figures, before facing a downturn in subsequent years.
The data reveals that while Cintas Corporation maintained a steady upward trajectory, XPO Logistics, Inc. encountered fluctuations, highlighting the challenges in the logistics sector. Notably, the absence of data for XPO in 2024 suggests potential reporting delays or strategic shifts. This analysis underscores the importance of adaptability and strategic foresight in sustaining financial growth.
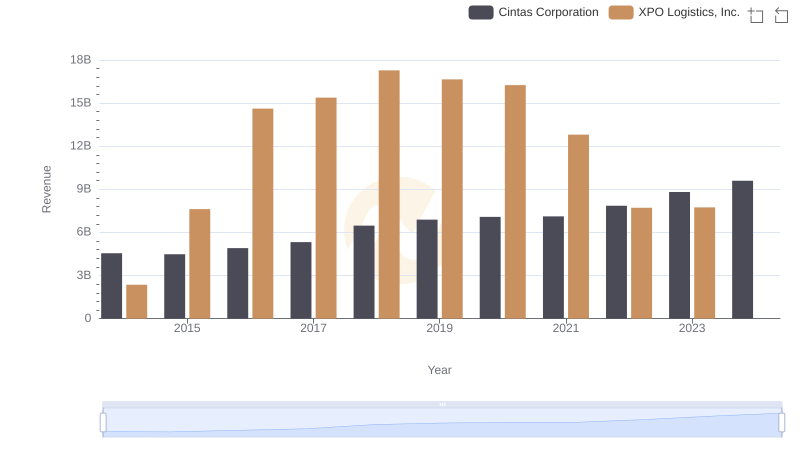
Breaking Down Revenue Trends: Cintas Corporation vs XPO Logistics, Inc.
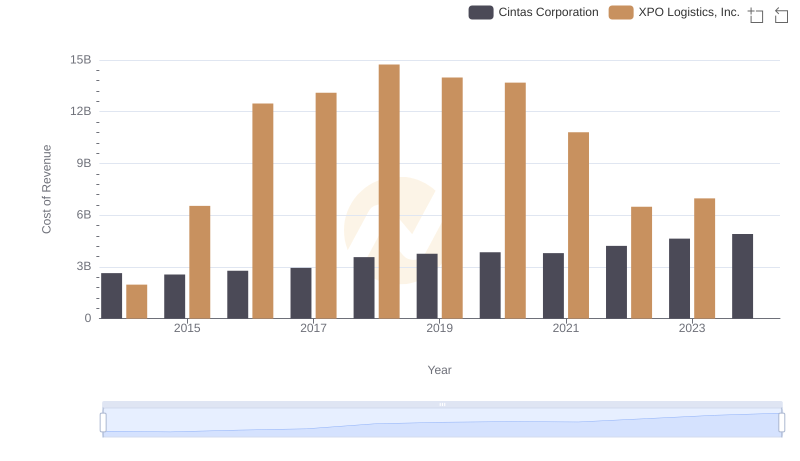
Cost of Revenue Comparison: Cintas Corporation vs XPO Logistics, Inc.
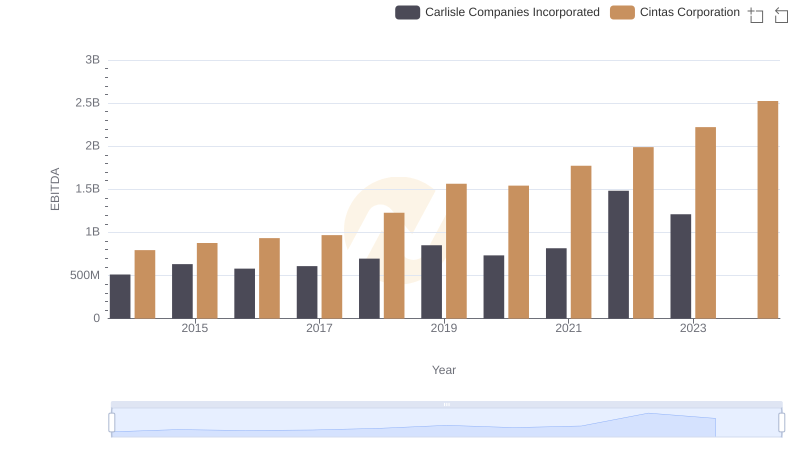
EBITDA Metrics Evaluated: Cintas Corporation vs Carlisle Companies Incorporated
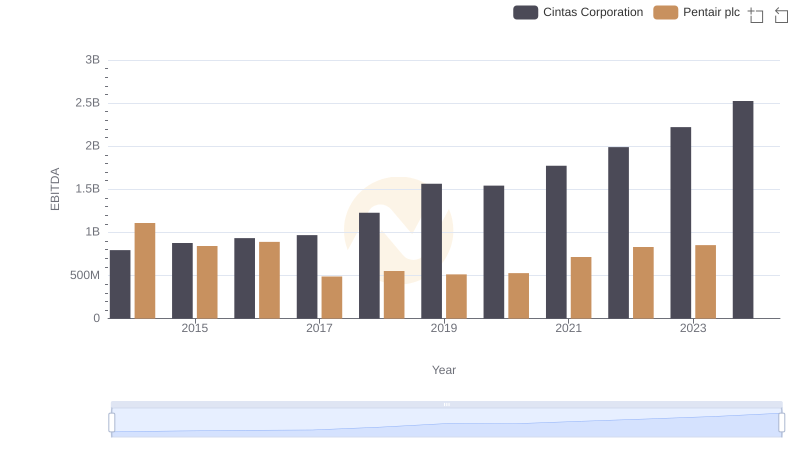
Professional EBITDA Benchmarking: Cintas Corporation vs Pentair plc
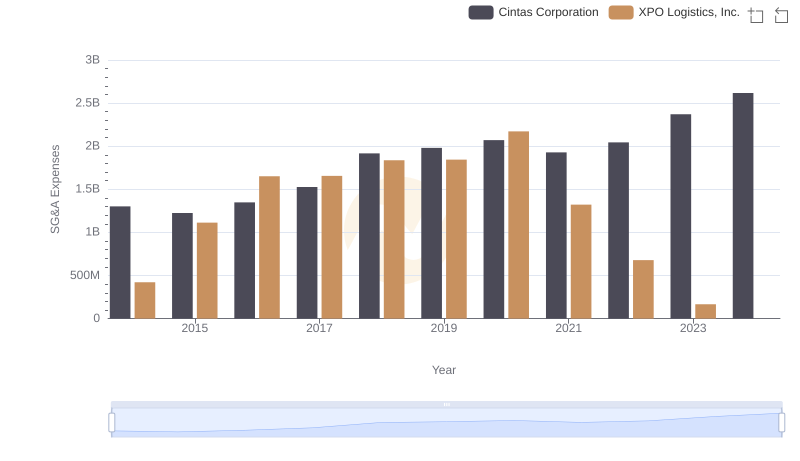
SG&A Efficiency Analysis: Comparing Cintas Corporation and XPO Logistics, Inc.
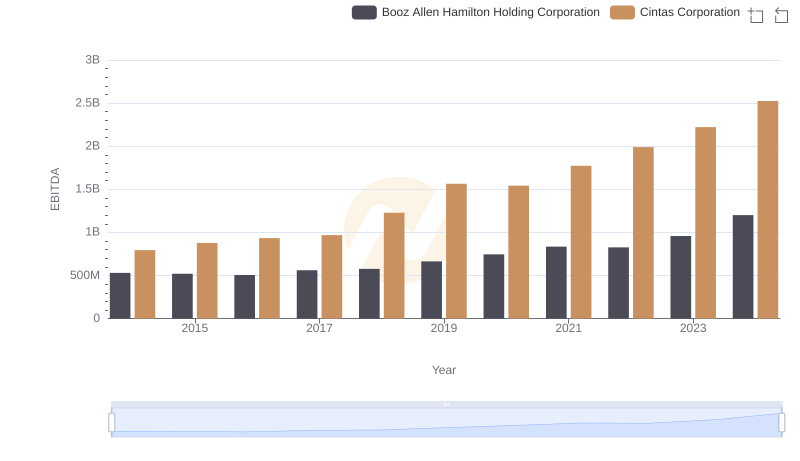
Cintas Corporation and Booz Allen Hamilton Holding Corporation: A Detailed Examination of EBITDA Performance
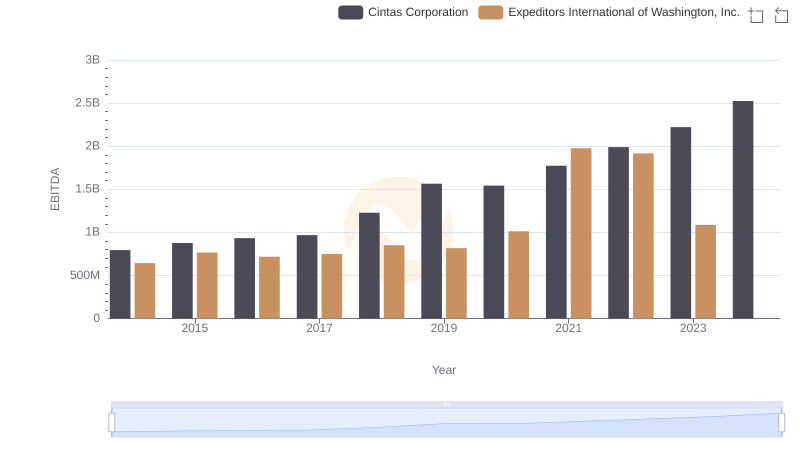
EBITDA Analysis: Evaluating Cintas Corporation Against Expeditors International of Washington, Inc.
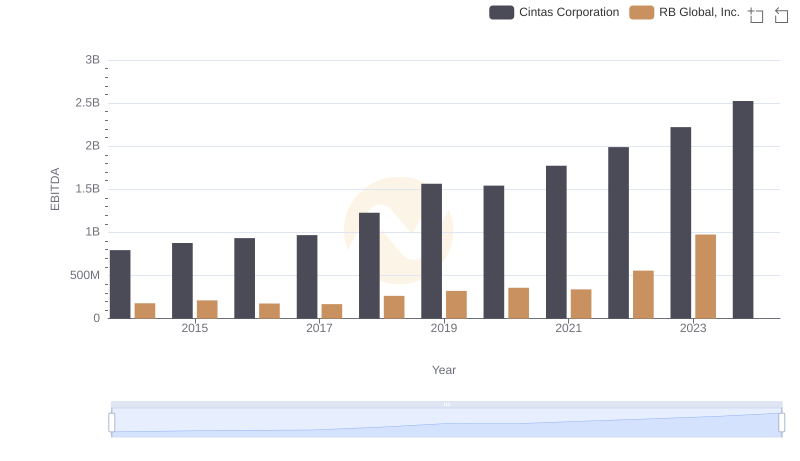
Cintas Corporation and RB Global, Inc.: A Detailed Examination of EBITDA Performance
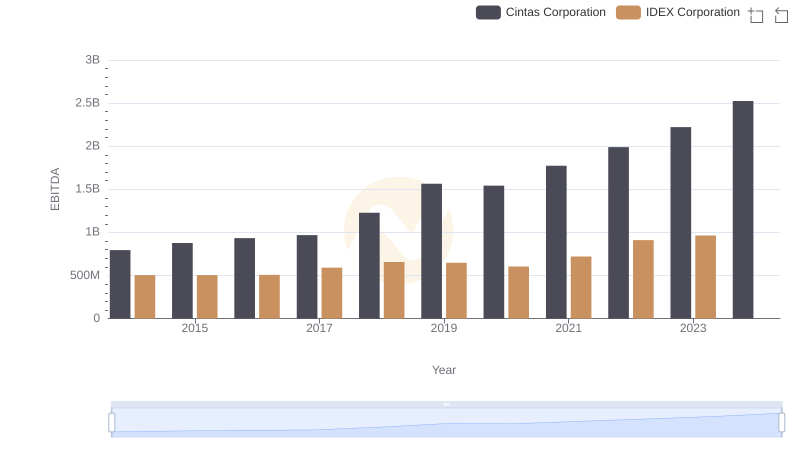
A Side-by-Side Analysis of EBITDA: Cintas Corporation and IDEX Corporation