| __timestamp | AMETEK, Inc. | Booz Allen Hamilton Holding Corporation |
|---|---|---|
| Wednesday, January 1, 2014 | 1023344000 | 531144000 |
| Thursday, January 1, 2015 | 1093776000 | 520410000 |
| Friday, January 1, 2016 | 1007213000 | 506120000 |
| Sunday, January 1, 2017 | 1068174000 | 561524000 |
| Monday, January 1, 2018 | 1269415000 | 577061000 |
| Tuesday, January 1, 2019 | 1411422000 | 663731000 |
| Wednesday, January 1, 2020 | 1283159000 | 745424000 |
| Friday, January 1, 2021 | 1600782000 | 834449000 |
| Saturday, January 1, 2022 | 1820119000 | 826865000 |
| Sunday, January 1, 2023 | 2025843000 | 958150000 |
| Monday, January 1, 2024 | 1779562000 | 1199992000 |
In pursuit of knowledge
In the ever-evolving landscape of corporate finance, EBITDA (Earnings Before Interest, Taxes, Depreciation, and Amortization) serves as a crucial metric for evaluating a company's operational performance. This analysis pits AMETEK, Inc. against Booz Allen Hamilton Holding Corporation, two giants in their respective industries, over a decade-long period starting in 2014.
AMETEK, Inc. has demonstrated a robust growth trajectory, with its EBITDA increasing by approximately 98% from 2014 to 2023. In contrast, Booz Allen Hamilton's EBITDA grew by about 80% over the same period. Notably, AMETEK's EBITDA surpassed Booz Allen Hamilton's by a significant margin in 2023, highlighting its strong operational efficiency.
While the data for 2024 is incomplete for AMETEK, Booz Allen Hamilton shows a promising increase, suggesting potential future growth. This analysis underscores the importance of EBITDA as a key performance indicator in assessing corporate health and growth potential.
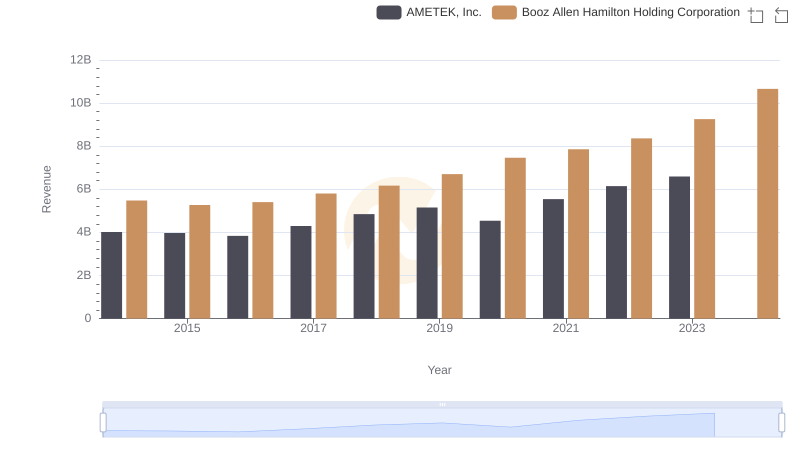
AMETEK, Inc. vs Booz Allen Hamilton Holding Corporation: Examining Key Revenue Metrics
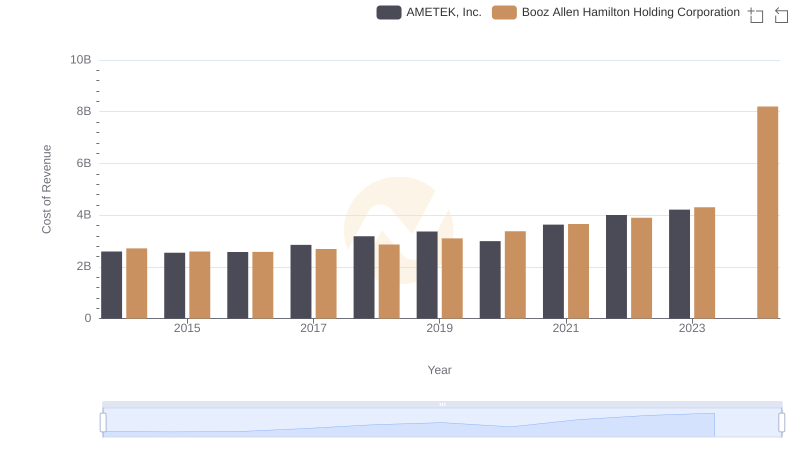
Cost of Revenue Comparison: AMETEK, Inc. vs Booz Allen Hamilton Holding Corporation
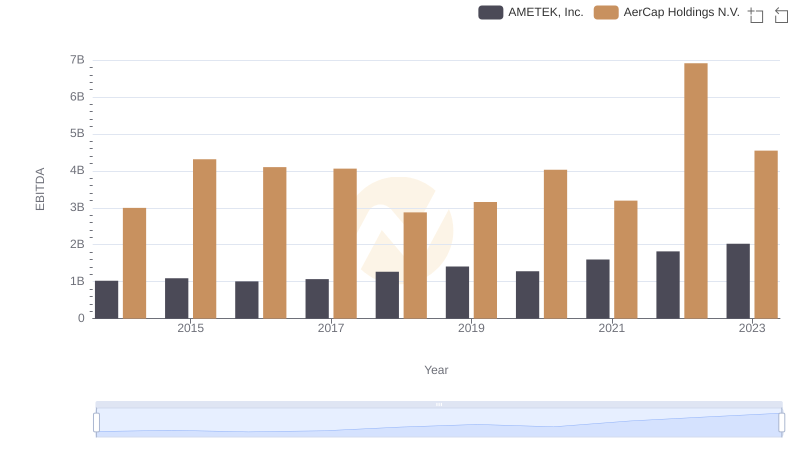
AMETEK, Inc. vs AerCap Holdings N.V.: In-Depth EBITDA Performance Comparison
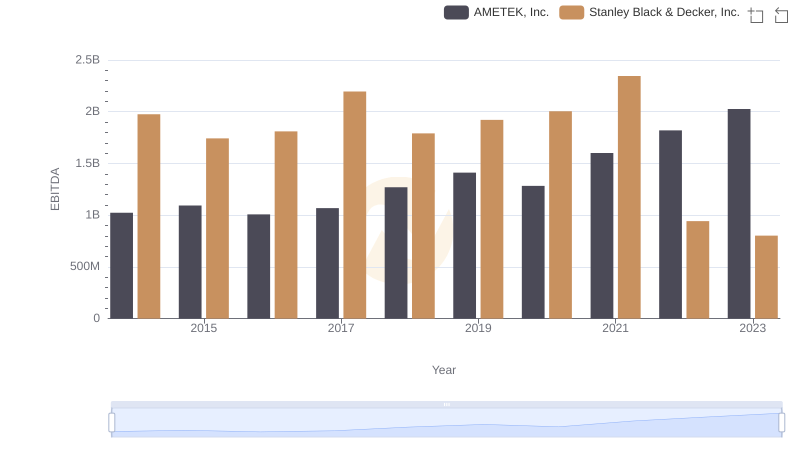
Comparative EBITDA Analysis: AMETEK, Inc. vs Stanley Black & Decker, Inc.
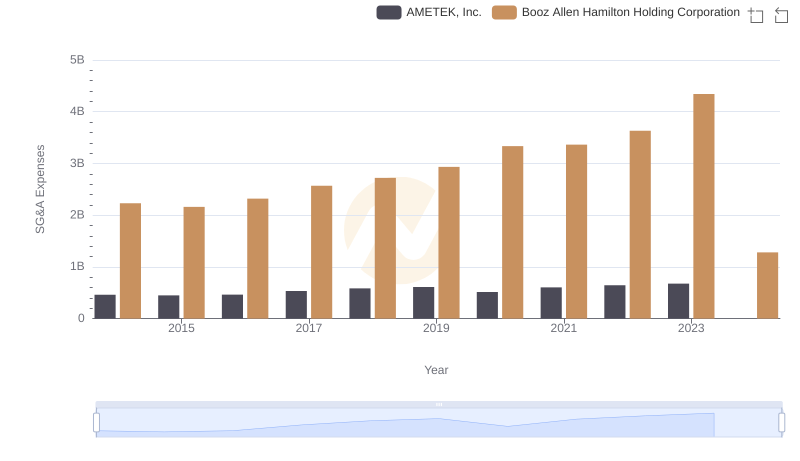
AMETEK, Inc. or Booz Allen Hamilton Holding Corporation: Who Manages SG&A Costs Better?
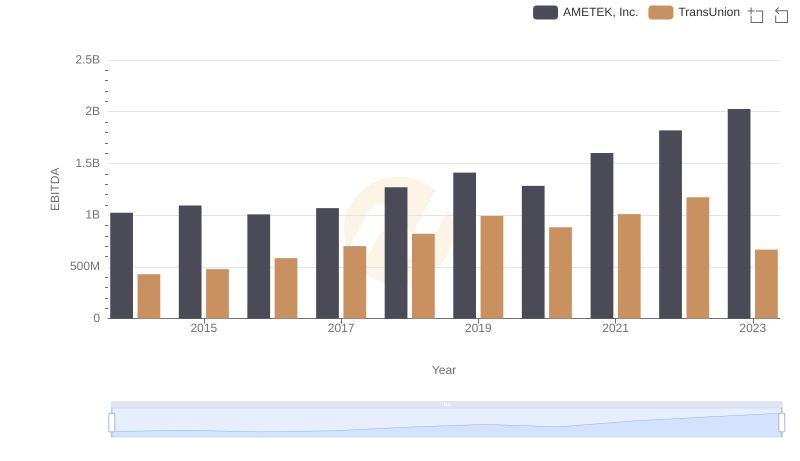
A Professional Review of EBITDA: AMETEK, Inc. Compared to TransUnion
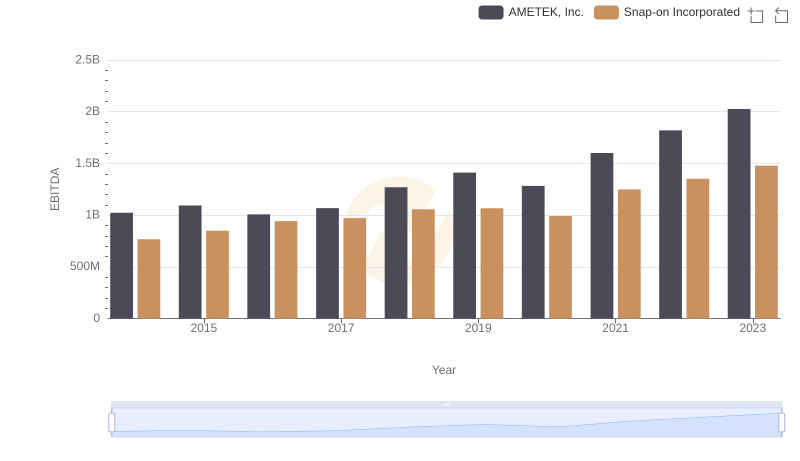
A Side-by-Side Analysis of EBITDA: AMETEK, Inc. and Snap-on Incorporated
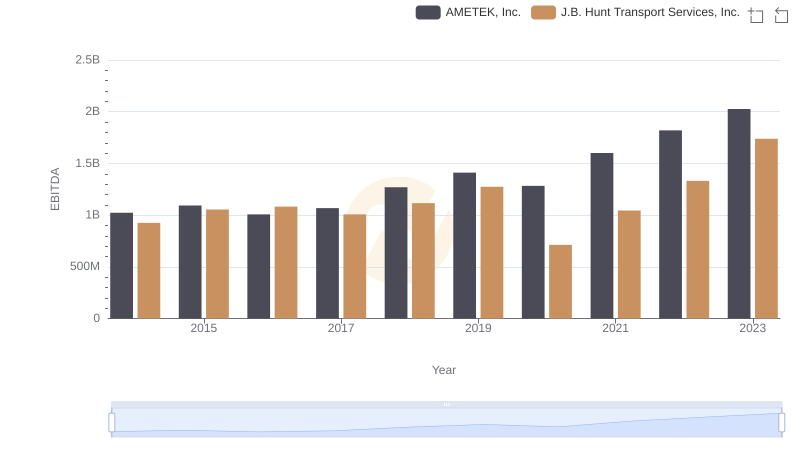
AMETEK, Inc. and J.B. Hunt Transport Services, Inc.: A Detailed Examination of EBITDA Performance
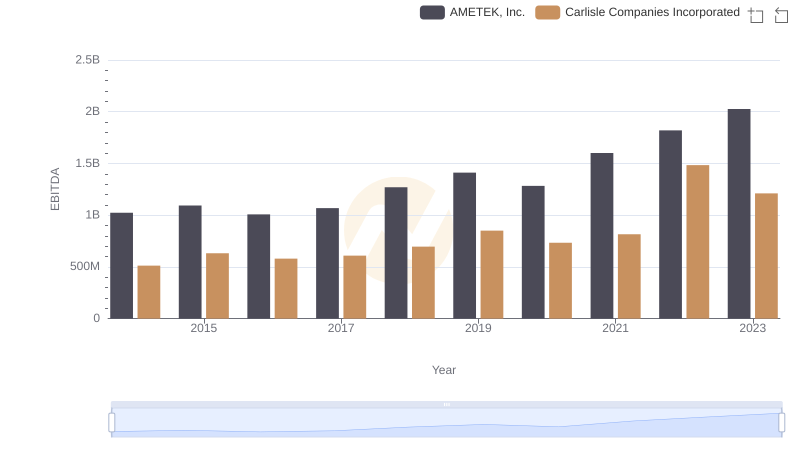
AMETEK, Inc. and Carlisle Companies Incorporated: A Detailed Examination of EBITDA Performance
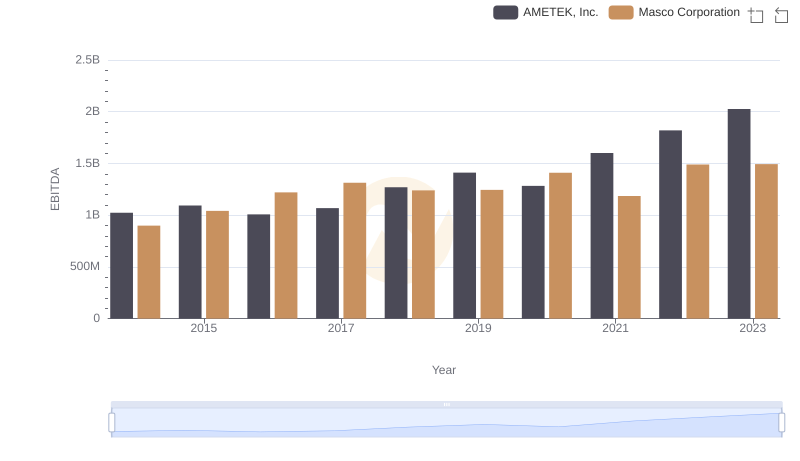
EBITDA Metrics Evaluated: AMETEK, Inc. vs Masco Corporation
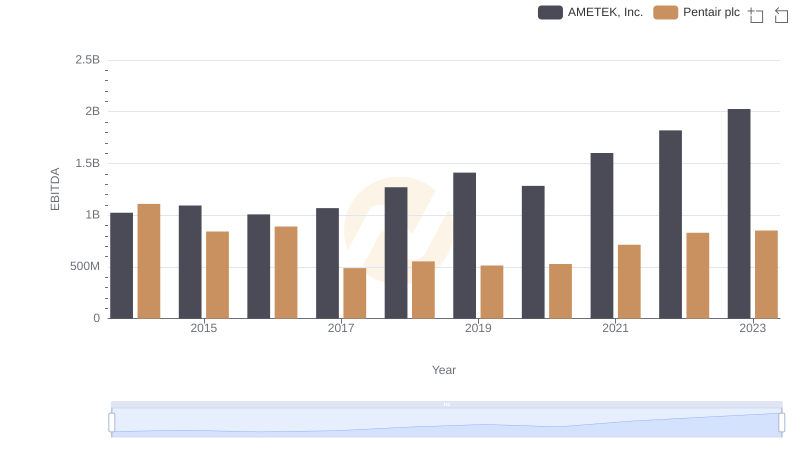
A Professional Review of EBITDA: AMETEK, Inc. Compared to Pentair plc