| __timestamp | AMETEK, Inc. | Snap-on Incorporated |
|---|---|---|
| Wednesday, January 1, 2014 | 1023344000 | 767600000 |
| Thursday, January 1, 2015 | 1093776000 | 848900000 |
| Friday, January 1, 2016 | 1007213000 | 942400000 |
| Sunday, January 1, 2017 | 1068174000 | 971900000 |
| Monday, January 1, 2018 | 1269415000 | 1057400000 |
| Tuesday, January 1, 2019 | 1411422000 | 1067000000 |
| Wednesday, January 1, 2020 | 1283159000 | 991400000 |
| Friday, January 1, 2021 | 1600782000 | 1249100000 |
| Saturday, January 1, 2022 | 1820119000 | 1351500000 |
| Sunday, January 1, 2023 | 2025843000 | 1478800000 |
| Monday, January 1, 2024 | 1779562000 | 1520700000 |
Data in motion
In the world of industrial manufacturing, AMETEK, Inc. and Snap-on Incorporated have been stalwarts of financial growth. Over the past decade, from 2014 to 2023, both companies have demonstrated impressive EBITDA growth, a key indicator of financial health. AMETEK, Inc. has seen its EBITDA rise by nearly 98%, from approximately $1.02 billion in 2014 to over $2 billion in 2023. Snap-on Incorporated, while starting at a lower base of around $768 million in 2014, has also shown robust growth, achieving a 93% increase to approximately $1.48 billion by 2023.
This side-by-side analysis highlights AMETEK's consistent upward trajectory, particularly from 2020 onwards, where it outpaced Snap-on's growth rate. As both companies continue to innovate and expand, their financial performance remains a testament to their strategic prowess in the competitive industrial sector.
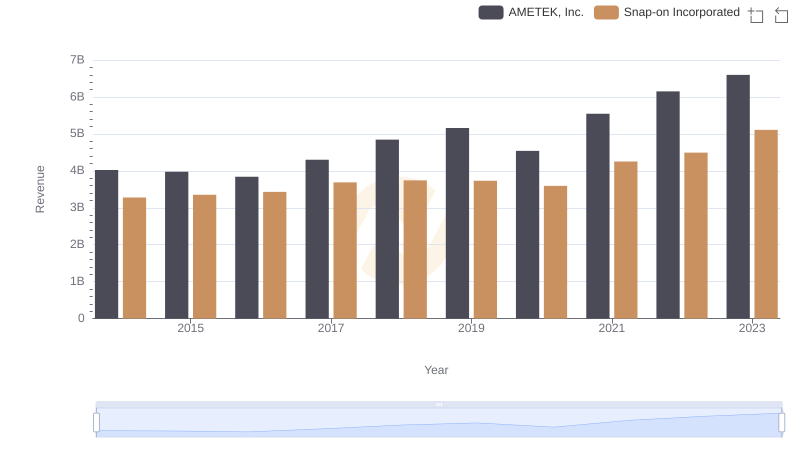
Annual Revenue Comparison: AMETEK, Inc. vs Snap-on Incorporated
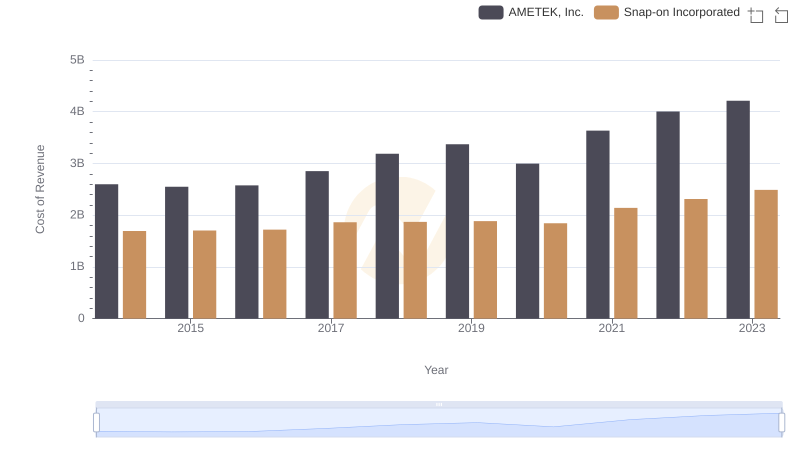
Cost of Revenue Trends: AMETEK, Inc. vs Snap-on Incorporated
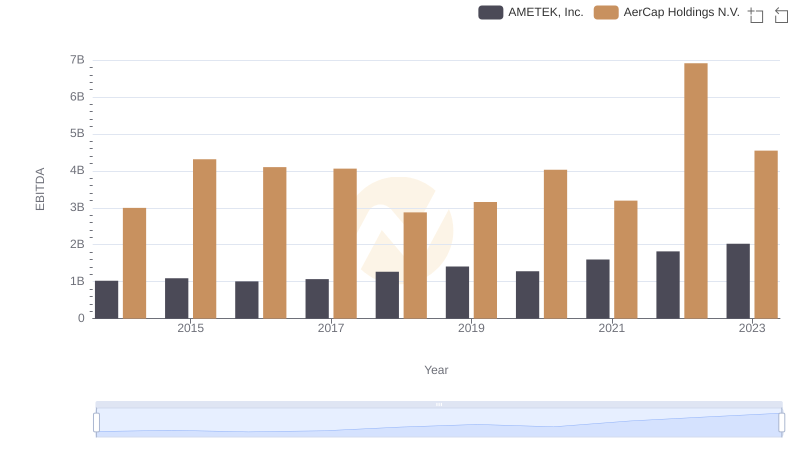
AMETEK, Inc. vs AerCap Holdings N.V.: In-Depth EBITDA Performance Comparison
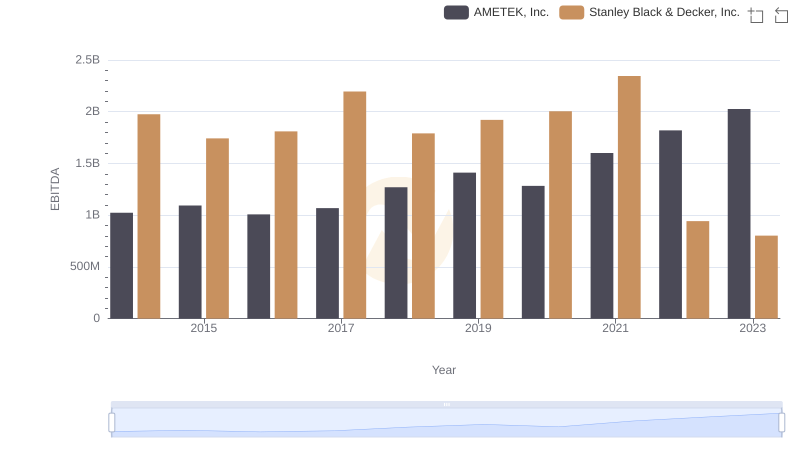
Comparative EBITDA Analysis: AMETEK, Inc. vs Stanley Black & Decker, Inc.
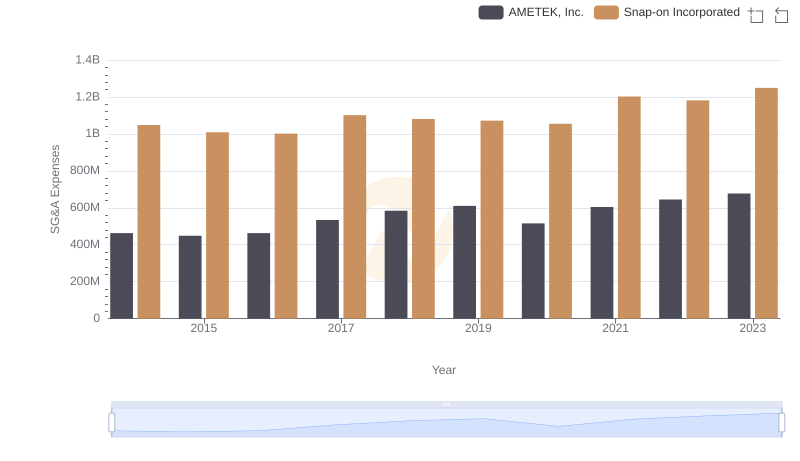
AMETEK, Inc. vs Snap-on Incorporated: SG&A Expense Trends
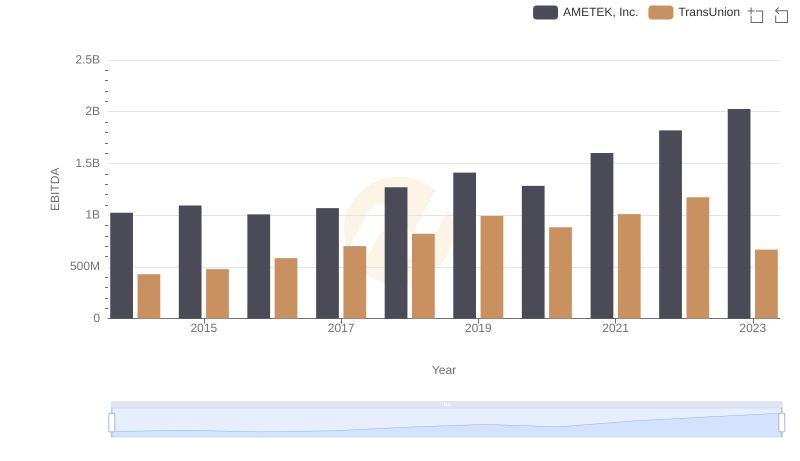
A Professional Review of EBITDA: AMETEK, Inc. Compared to TransUnion
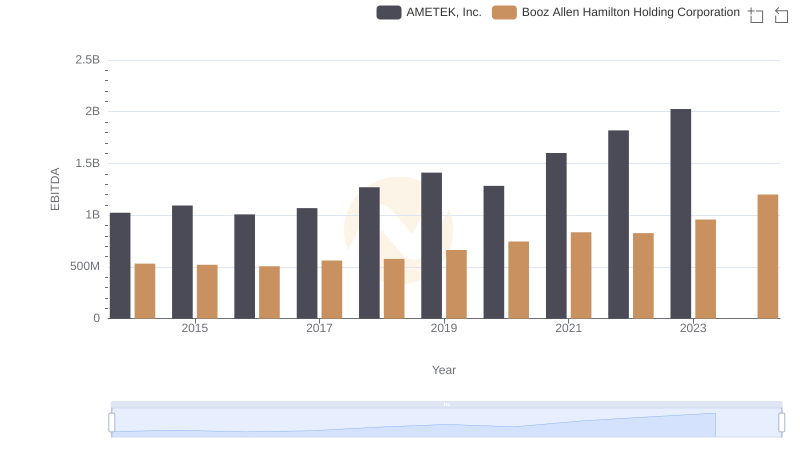
EBITDA Metrics Evaluated: AMETEK, Inc. vs Booz Allen Hamilton Holding Corporation
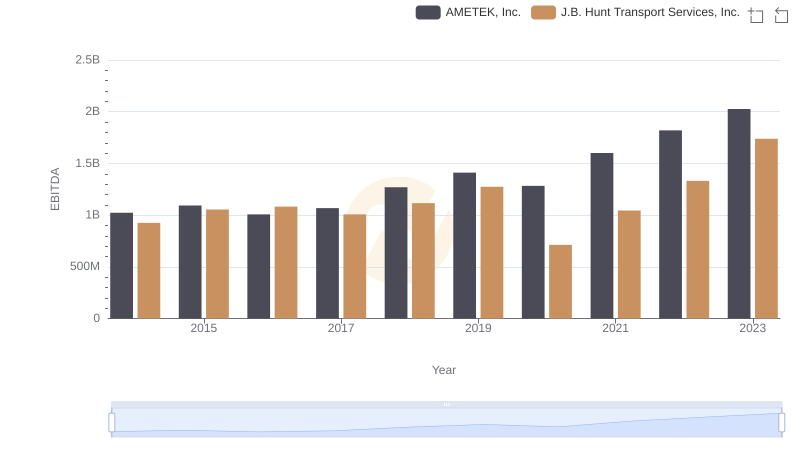
AMETEK, Inc. and J.B. Hunt Transport Services, Inc.: A Detailed Examination of EBITDA Performance
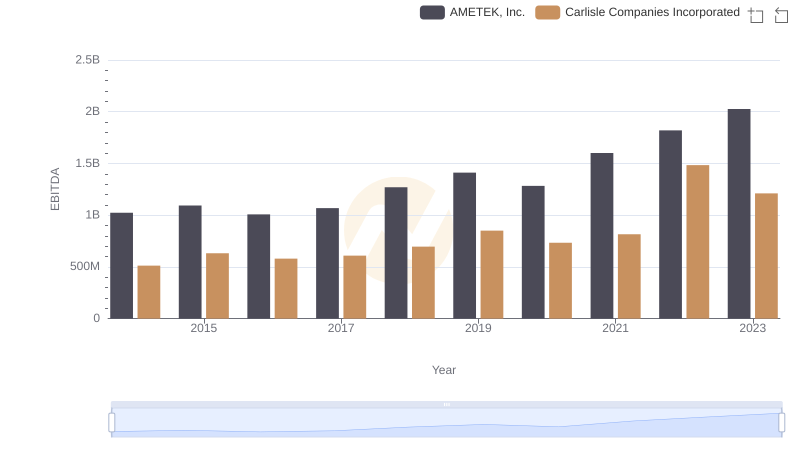
AMETEK, Inc. and Carlisle Companies Incorporated: A Detailed Examination of EBITDA Performance
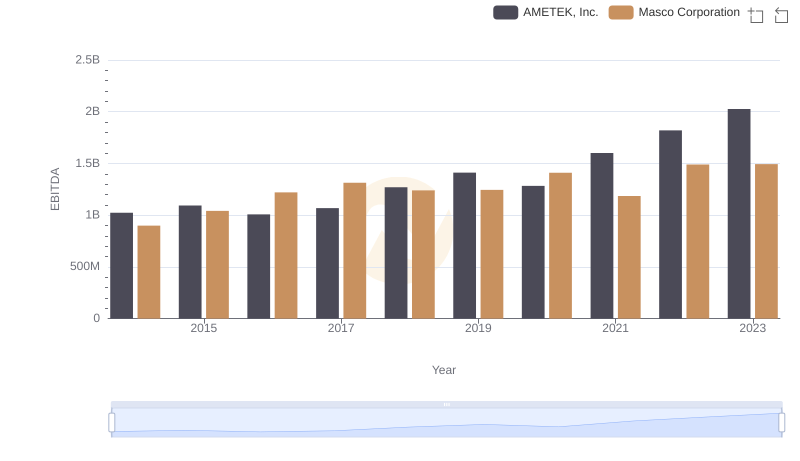
EBITDA Metrics Evaluated: AMETEK, Inc. vs Masco Corporation