| __timestamp | AMETEK, Inc. | Booz Allen Hamilton Holding Corporation |
|---|---|---|
| Wednesday, January 1, 2014 | 4021964000 | 5478693000 |
| Thursday, January 1, 2015 | 3974295000 | 5274770000 |
| Friday, January 1, 2016 | 3840087000 | 5405738000 |
| Sunday, January 1, 2017 | 4300170000 | 5804284000 |
| Monday, January 1, 2018 | 4845872000 | 6171853000 |
| Tuesday, January 1, 2019 | 5158557000 | 6704037000 |
| Wednesday, January 1, 2020 | 4540029000 | 7463841000 |
| Friday, January 1, 2021 | 5546514000 | 7858938000 |
| Saturday, January 1, 2022 | 6150530000 | 8363700000 |
| Sunday, January 1, 2023 | 6596950000 | 9258911000 |
| Monday, January 1, 2024 | 6941180000 | 10661896000 |
Cracking the code
In the ever-evolving landscape of American industry, AMETEK, Inc. and Booz Allen Hamilton Holding Corporation have emerged as key players. Over the past decade, from 2014 to 2023, these companies have demonstrated remarkable revenue trajectories. AMETEK, Inc. saw its revenue grow by approximately 64%, starting from $4 billion in 2014 and reaching nearly $6.6 billion by 2023. Meanwhile, Booz Allen Hamilton experienced a robust 69% increase, with revenues climbing from $5.5 billion to an impressive $9.3 billion in the same period.
While AMETEK's growth was steady, Booz Allen Hamilton's revenue surged, particularly in the latter half of the decade. Notably, 2024 data for AMETEK is missing, leaving room for speculation on its future performance. This comparison highlights the dynamic nature of these industries and the strategic maneuvers that drive such growth.

AMETEK, Inc. vs Stanley Black & Decker, Inc.: Annual Revenue Growth Compared
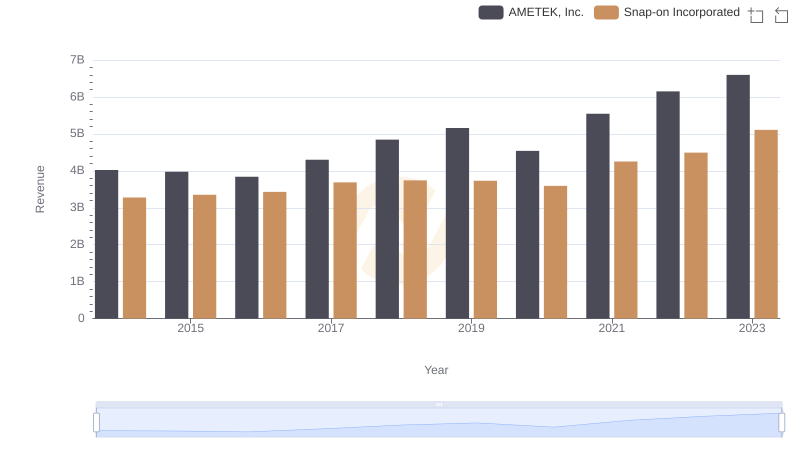
Annual Revenue Comparison: AMETEK, Inc. vs Snap-on Incorporated
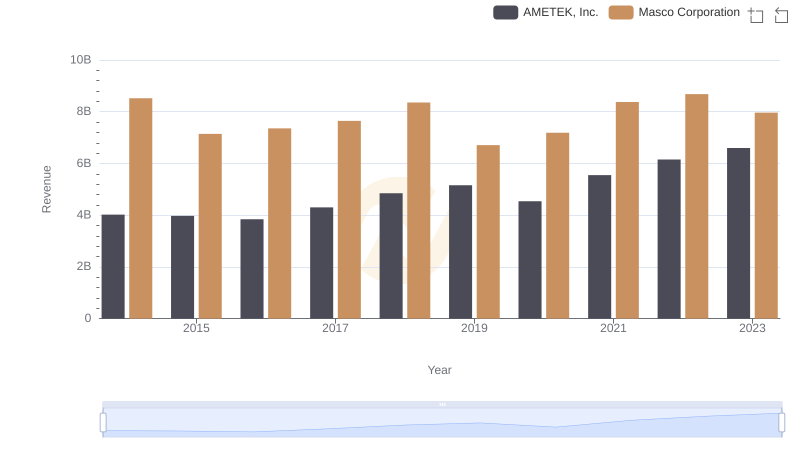
Breaking Down Revenue Trends: AMETEK, Inc. vs Masco Corporation
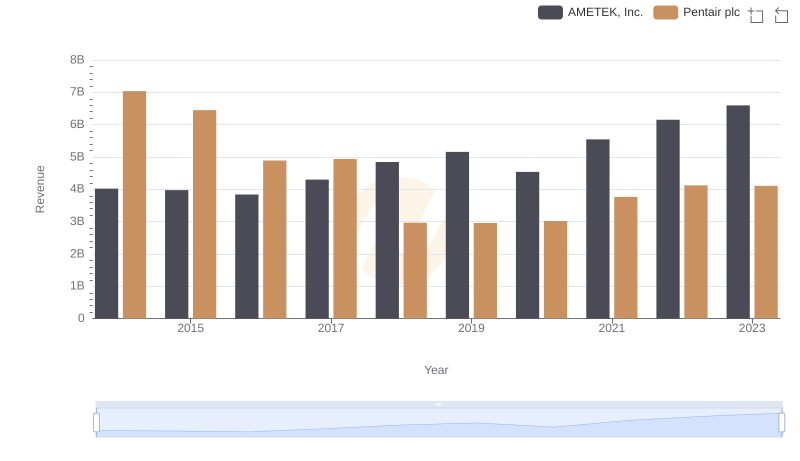
AMETEK, Inc. vs Pentair plc: Annual Revenue Growth Compared
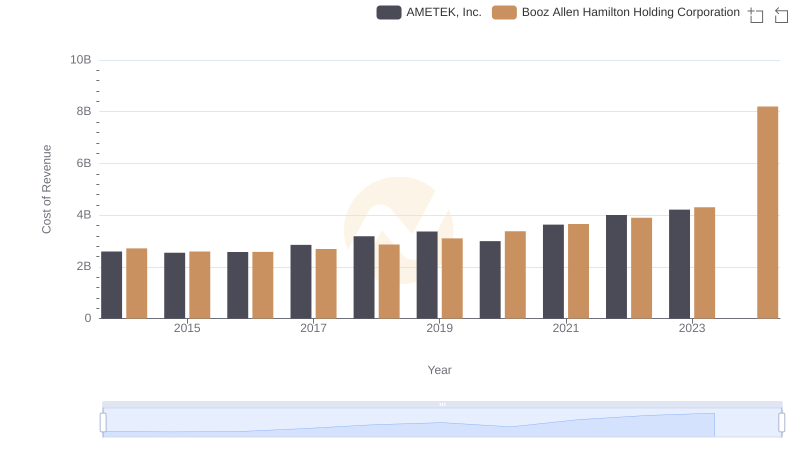
Cost of Revenue Comparison: AMETEK, Inc. vs Booz Allen Hamilton Holding Corporation
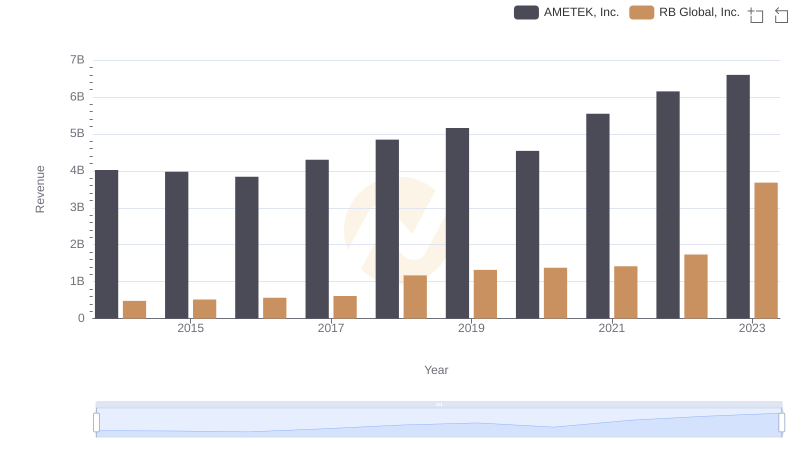
AMETEK, Inc. and RB Global, Inc.: A Comprehensive Revenue Analysis
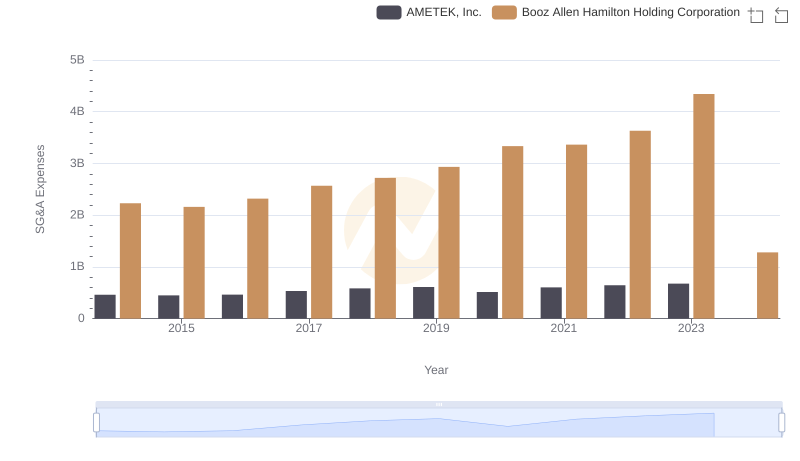
AMETEK, Inc. or Booz Allen Hamilton Holding Corporation: Who Manages SG&A Costs Better?
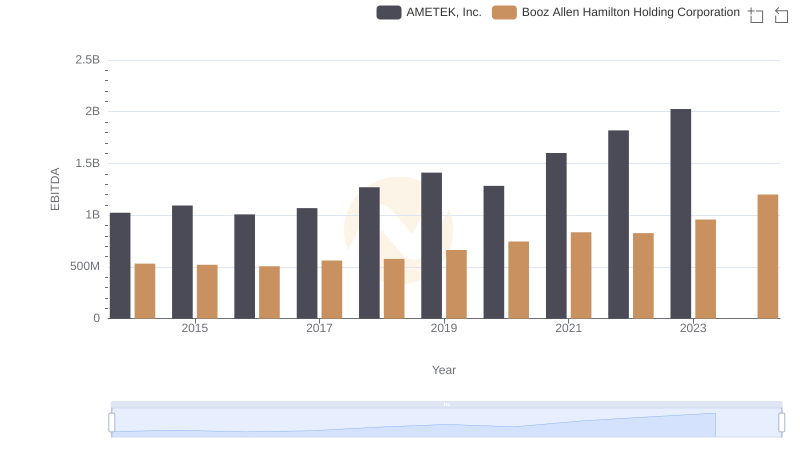
EBITDA Metrics Evaluated: AMETEK, Inc. vs Booz Allen Hamilton Holding Corporation