| __timestamp | AMETEK, Inc. | Stanley Black & Decker, Inc. |
|---|---|---|
| Wednesday, January 1, 2014 | 1023344000 | 1975400000 |
| Thursday, January 1, 2015 | 1093776000 | 1741900000 |
| Friday, January 1, 2016 | 1007213000 | 1810200000 |
| Sunday, January 1, 2017 | 1068174000 | 2196000000 |
| Monday, January 1, 2018 | 1269415000 | 1791200000 |
| Tuesday, January 1, 2019 | 1411422000 | 1920600000 |
| Wednesday, January 1, 2020 | 1283159000 | 2004200000 |
| Friday, January 1, 2021 | 1600782000 | 2345500000 |
| Saturday, January 1, 2022 | 1820119000 | 942800000 |
| Sunday, January 1, 2023 | 2025843000 | 802700000 |
| Monday, January 1, 2024 | 1779562000 | 286300000 |
In pursuit of knowledge
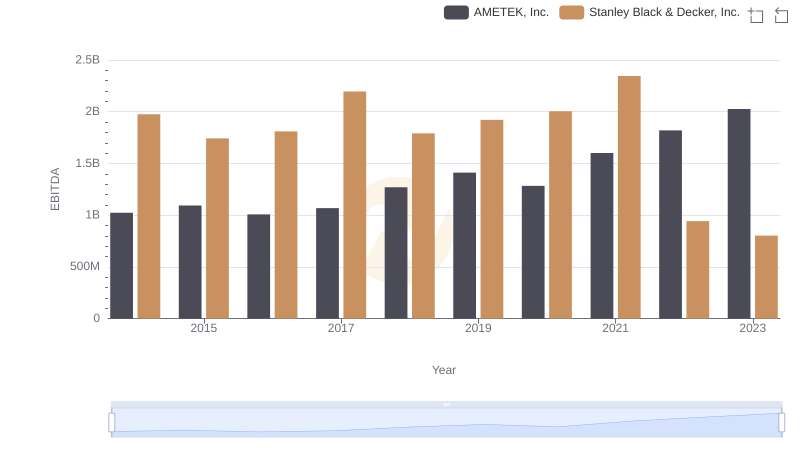
In the ever-evolving landscape of industrial manufacturing, AMETEK, Inc. and Stanley Black & Decker, Inc. have emerged as formidable players. Over the past decade, these companies have showcased contrasting trajectories in their EBITDA performance. From 2014 to 2023, AMETEK's EBITDA has surged by approximately 98%, reflecting its robust growth strategy and market adaptability. In contrast, Stanley Black & Decker experienced a decline of around 59% in the same period, highlighting challenges in maintaining its market position.
The year 2021 marked a peak for both companies, with Stanley Black & Decker achieving its highest EBITDA, only to witness a sharp decline in subsequent years. Meanwhile, AMETEK continued its upward trend, culminating in its highest EBITDA in 2023. This comparative analysis underscores the dynamic nature of the industrial sector and the strategic maneuvers companies must employ to thrive.

AMETEK, Inc. vs Stanley Black & Decker, Inc.: Annual Revenue Growth Compared
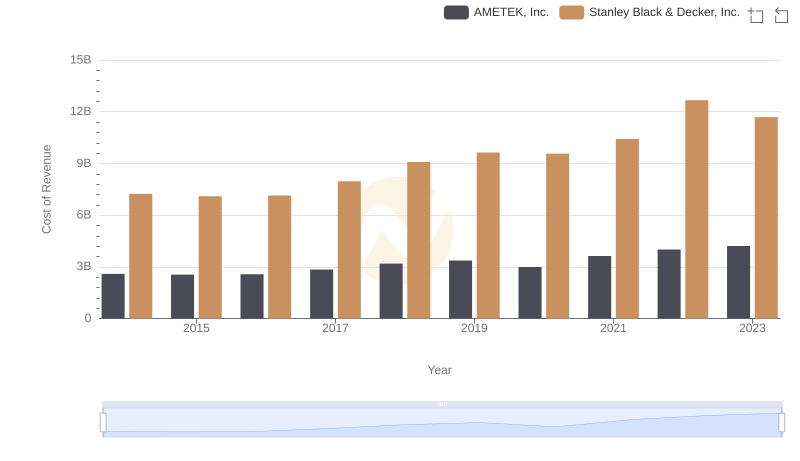
Comparing Cost of Revenue Efficiency: AMETEK, Inc. vs Stanley Black & Decker, Inc.

AMETEK, Inc. and Stanley Black & Decker, Inc.: SG&A Spending Patterns Compared
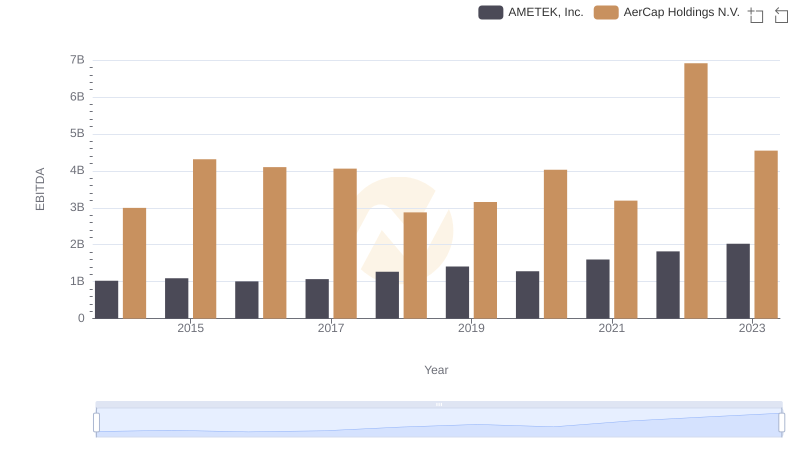
AMETEK, Inc. vs AerCap Holdings N.V.: In-Depth EBITDA Performance Comparison
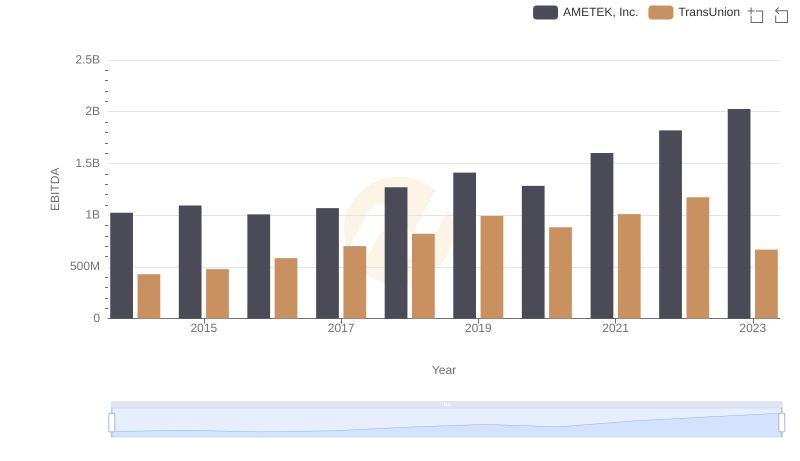
A Professional Review of EBITDA: AMETEK, Inc. Compared to TransUnion
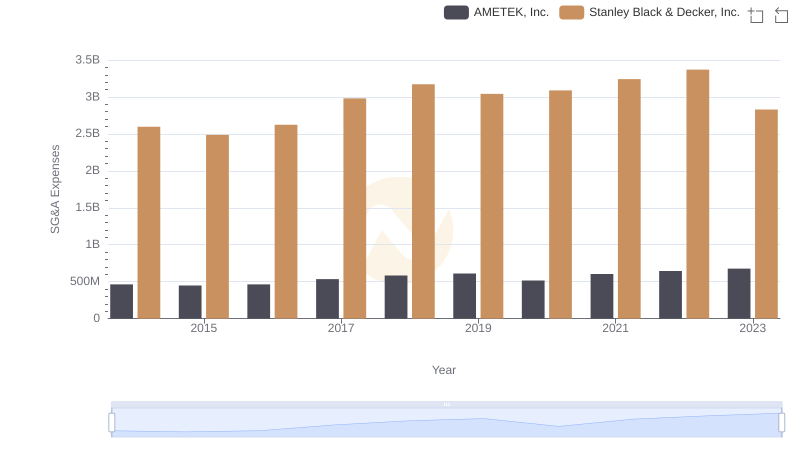
AMETEK, Inc. and Stanley Black & Decker, Inc.: SG&A Spending Patterns Compared
Professional EBITDA Benchmarking: AMETEK, Inc. vs Stanley Black & Decker, Inc.