| __timestamp | AMETEK, Inc. | Masco Corporation |
|---|---|---|
| Wednesday, January 1, 2014 | 1023344000 | 899000000 |
| Thursday, January 1, 2015 | 1093776000 | 1041000000 |
| Friday, January 1, 2016 | 1007213000 | 1220000000 |
| Sunday, January 1, 2017 | 1068174000 | 1314000000 |
| Monday, January 1, 2018 | 1269415000 | 1240000000 |
| Tuesday, January 1, 2019 | 1411422000 | 1244000000 |
| Wednesday, January 1, 2020 | 1283159000 | 1410000000 |
| Friday, January 1, 2021 | 1600782000 | 1185000000 |
| Saturday, January 1, 2022 | 1820119000 | 1490000000 |
| Sunday, January 1, 2023 | 2025843000 | 1493000000 |
| Monday, January 1, 2024 | 1779562000 | 1410000000 |
Unleashing the power of data
In the ever-evolving landscape of industrial and home improvement sectors, AMETEK, Inc. and Masco Corporation have emerged as significant players. Over the past decade, from 2014 to 2023, these companies have demonstrated notable EBITDA growth, a key indicator of financial health and operational efficiency.
AMETEK, Inc. has shown a remarkable upward trajectory, with its EBITDA increasing by approximately 98% over this period. Starting at around $1 billion in 2014, it reached over $2 billion by 2023. This growth underscores AMETEK's strategic initiatives and robust market positioning.
Conversely, Masco Corporation experienced a steady yet modest growth of about 66%, with its EBITDA rising from nearly $900 million in 2014 to approximately $1.5 billion in 2023. This reflects Masco's consistent performance in the competitive home improvement industry.
This comparative analysis highlights the dynamic nature of these industries and the strategic maneuvers of these corporations.
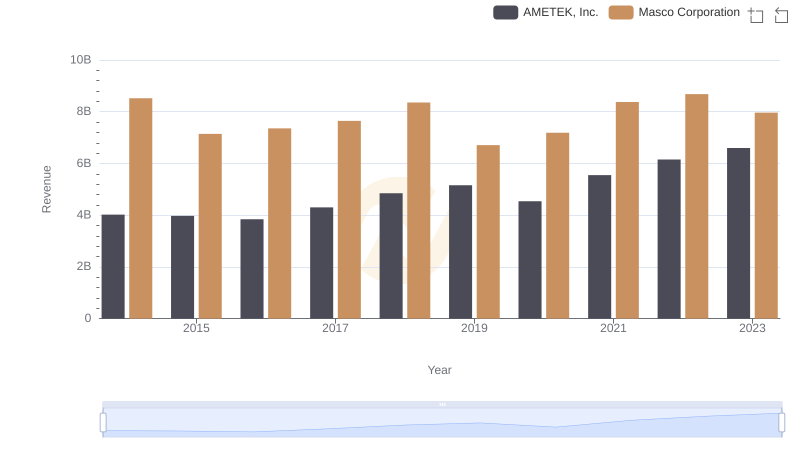
Breaking Down Revenue Trends: AMETEK, Inc. vs Masco Corporation
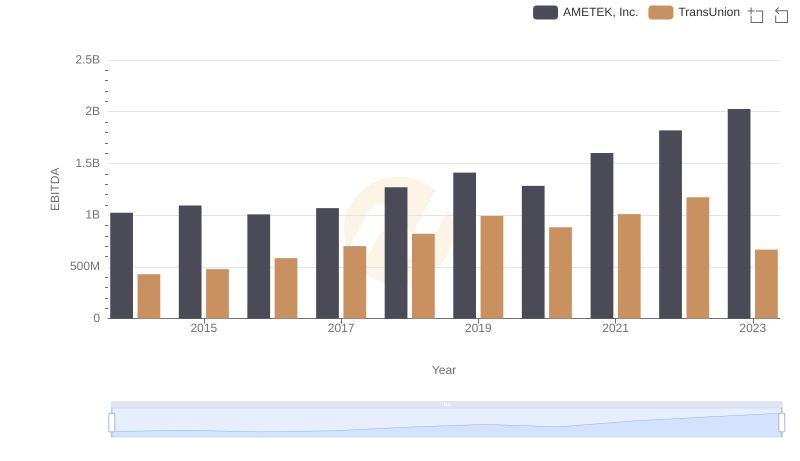
A Professional Review of EBITDA: AMETEK, Inc. Compared to TransUnion
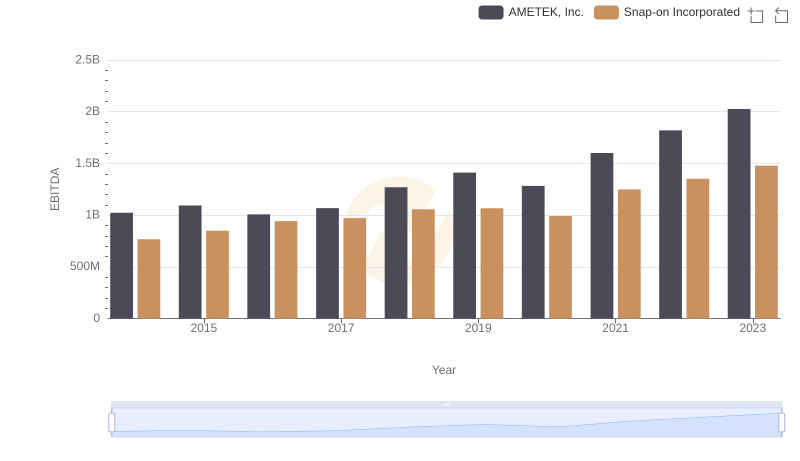
A Side-by-Side Analysis of EBITDA: AMETEK, Inc. and Snap-on Incorporated
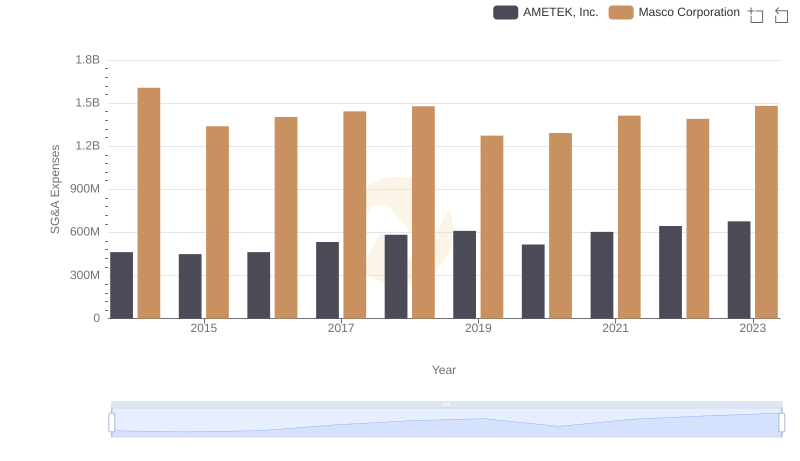
Cost Management Insights: SG&A Expenses for AMETEK, Inc. and Masco Corporation
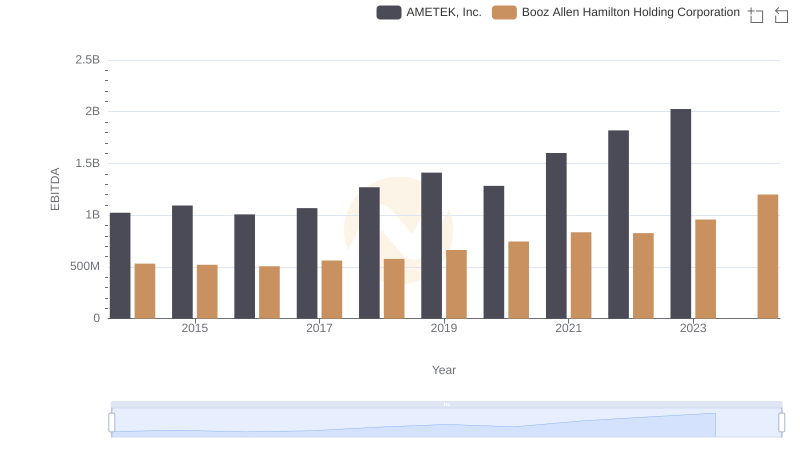
EBITDA Metrics Evaluated: AMETEK, Inc. vs Booz Allen Hamilton Holding Corporation
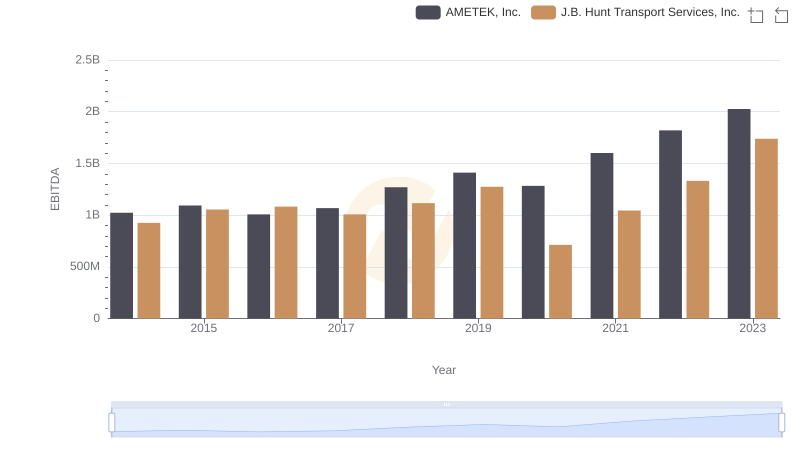
AMETEK, Inc. and J.B. Hunt Transport Services, Inc.: A Detailed Examination of EBITDA Performance
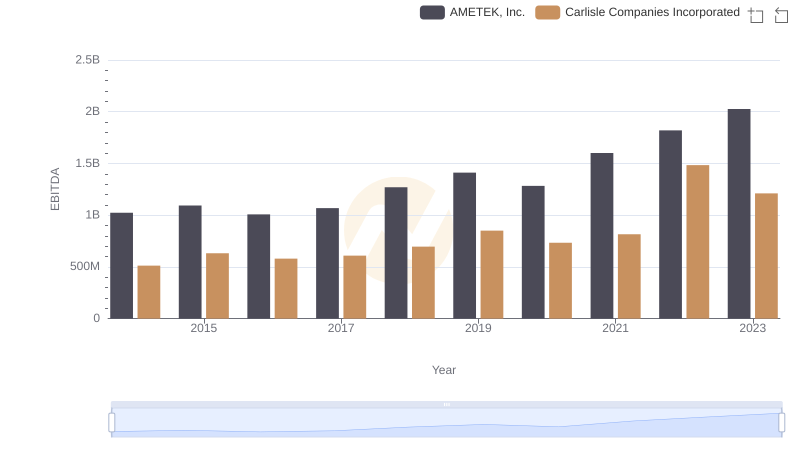
AMETEK, Inc. and Carlisle Companies Incorporated: A Detailed Examination of EBITDA Performance
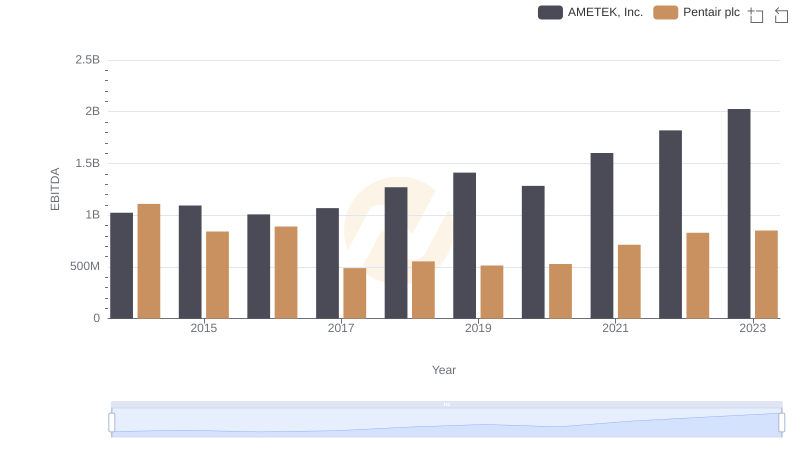
A Professional Review of EBITDA: AMETEK, Inc. Compared to Pentair plc
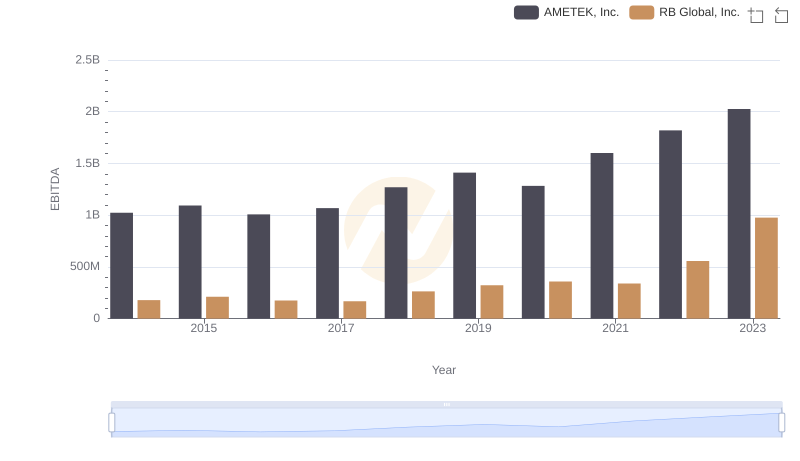
A Professional Review of EBITDA: AMETEK, Inc. Compared to RB Global, Inc.